Africa Foreign Investor Survey 2005 - unido
Africa Foreign Investor Survey 2005 - unido
Africa Foreign Investor Survey 2005 - unido

Create successful ePaper yourself
Turn your PDF publications into a flip-book with our unique Google optimized e-Paper software.
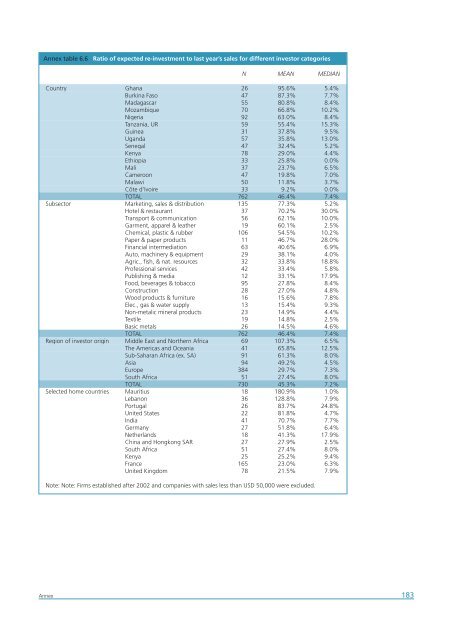
Annex table 6.6 Ratio of expected re-investment to last year’s sales for different investor categories<br />
N MEAN MEDIAN<br />
Country Ghana 26 95.6% 5.4%<br />
Burkina Faso 47 87.3% 7.7%<br />
Madagascar 55 80.8% 8.4%<br />
Mozambique 70 66.8% 10.2%<br />
Nigeria 92 63.0% 8.4%<br />
Tanzania, UR 59 55.4% 15.3%<br />
Guinea 31 37.8% 9.5%<br />
Uganda 57 35.8% 13.0%<br />
Senegal 47 32.4% 5.2%<br />
Kenya 78 29.0% 4.4%<br />
Ethiopia 33 25.8% 0.0%<br />
Mali 37 23.7% 6.5%<br />
Cameroon 47 19.8% 7.0%<br />
Malawi 50 11.8% 3.7%<br />
Côte d’Ivoire 33 9.2% 0.0%<br />
TOTAL 762 46.4% 7.4%<br />
Subsector Marketing, sales & distribution 135 77.3% 5.2%<br />
Hotel & restaurant 37 70.2% 30.0%<br />
Transport & communication 56 62.1% 10.0%<br />
Garment, apparel & leather 19 60.1% 2.5%<br />
Chemical, plastic & rubber 106 54.5% 10.2%<br />
Paper & paper products 11 46.7% 28.0%<br />
Financial intermediation 63 40.6% 6.9%<br />
Auto, machinery & equipment 29 38.1% 4.0%<br />
Agric., fish, & nat. resources 32 33.8% 18.8%<br />
Professional services 42 33.4% 5.8%<br />
Publishing & media 12 33.1% 17.9%<br />
Food, beverages & tobacco 95 27.8% 8.4%<br />
Construction 28 27.0% 4.8%<br />
Wood products & furniture 16 15.6% 7.8%<br />
Elec., gas & water supply 13 15.4% 9.3%<br />
Non-metalic mineral products 23 14.9% 4.4%<br />
Textile 19 14.8% 2.5%<br />
Basic metals 26 14.5% 4.6%<br />
TOTAL 762 46.4% 7.4%<br />
Region of investor origin Middle East and Northern <strong>Africa</strong> 69 107.3% 6.5%<br />
The Americas and Oceania 41 65.8% 12.5%<br />
Sub-Saharan <strong>Africa</strong> (ex. SA) 91 61.3% 8.0%<br />
Asia 94 49.2% 4.5%<br />
Europe 384 29.7% 7.3%<br />
South <strong>Africa</strong> 51 27.4% 8.0%<br />
TOTAL 730 45.3% 7.2%<br />
Selected home countries Mauritius 18 180.9% 1.0%<br />
Lebanon 36 128.8% 7.9%<br />
Portugal 26 83.7% 24.8%<br />
United States 22 81.8% 4.7%<br />
India 41 70.7% 7.7%<br />
Germany 27 51.8% 6.4%<br />
Netherlands 18 41.3% 17.9%<br />
China and Hongkong SAR 27 27.9% 2.5%<br />
South <strong>Africa</strong> 51 27.4% 8.0%<br />
Kenya 25 25.2% 9.4%<br />
France 165 23.0% 6.3%<br />
United Kingdom 78 21.5% 7.9%<br />
Note: Note: Firms established after 2002 and companies with sales less than USD 50,000 were excluded.<br />
Annex<br />
183