Africa Foreign Investor Survey 2005 - unido
Africa Foreign Investor Survey 2005 - unido
Africa Foreign Investor Survey 2005 - unido

Create successful ePaper yourself
Turn your PDF publications into a flip-book with our unique Google optimized e-Paper software.
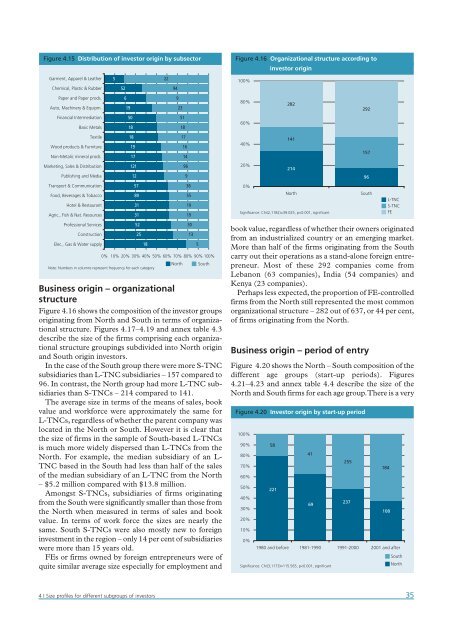
Figure 4.15 Distribution of investor origin by subsector<br />
Garment, Apparel & Leather<br />
Chemical, Plastic & Rubber<br />
Paper and Paper prods.<br />
Auto, Machinery & Equipm .<br />
Financial Intermediation<br />
Basic Metals<br />
Textile<br />
Wood products & Furniture<br />
Non-Metalic mineral prods.<br />
Marketing, Sales & Distribution<br />
Publishing and Media<br />
Transport & Communication<br />
Food, Beverages & Tobacco<br />
Hotel & Restaurant<br />
Agric., Fish & Nat. Resources<br />
Professional Services<br />
Construction<br />
Elec., Gas & Water supply<br />
121<br />
Note: Numbers in columns represent frequency for each category<br />
5<br />
52<br />
6<br />
19<br />
50<br />
18<br />
18<br />
Business origin – organizational<br />
structure<br />
Figure 4.16 shows the composition of the investor groups<br />
originating from North and South in terms of organizational<br />
structure. Figures 4.17–4.19 and annex table 4.3<br />
describe the size of the firms comprising each organizational<br />
structure groupings subdivided into North origin<br />
and South origin investors.<br />
In the case of the South group there were more S-TNC<br />
subsidiaries than L-TNC subsidiaries – 157 compared to<br />
96. In contrast, the North group had more L-TNC subsidiaries<br />
than S-TNCs – 214 compared to 141.<br />
The average size in terms of the means of sales, book<br />
value and workforce were approximately the same for<br />
L-TNCs, regardless of whether the parent company was<br />
located in the North or South. However it is clear that<br />
the size of firms in the sample of South-based L-TNCs<br />
is much more widely dispersed than L-TNCs from the<br />
North. For example, the median subsidiary of an L-<br />
TNC based in the South had less than half of the sales<br />
of the median subsidiary of an L-TNC from the North<br />
– $5.2 million compared with $13.8 million.<br />
Amongst S-TNCs, subsidiaries of firms originating<br />
from the South were significantly smaller than those from<br />
the North when measured in terms of sales and book<br />
value. In terms of work force the sizes are nearly the<br />
same. South S-TNCs were also mostly new to foreign<br />
investment in the region – only 14 per cent of subsidiaries<br />
were more than 15 years old.<br />
FEs or firms owned by foreign entrepreneurs were of<br />
quite similar average size especially for employment and<br />
19<br />
17<br />
12<br />
57<br />
89<br />
31<br />
31<br />
52<br />
25<br />
18<br />
0% 10% 20% 30% 40% 50% 60% 70% 80% 90% 100%<br />
22<br />
94<br />
9<br />
23<br />
51<br />
North<br />
18<br />
17<br />
16<br />
14<br />
96<br />
9<br />
36<br />
55<br />
19<br />
19<br />
30<br />
13<br />
5<br />
South<br />
Figure 4.16 Organizational structure according to<br />
investor origin<br />
100%<br />
80%<br />
60%<br />
40%<br />
20%<br />
0%<br />
282<br />
141<br />
214<br />
North<br />
Significance: Chi(2,1182)=39.025, p