Africa Foreign Investor Survey 2005 - unido
Africa Foreign Investor Survey 2005 - unido
Africa Foreign Investor Survey 2005 - unido

Create successful ePaper yourself
Turn your PDF publications into a flip-book with our unique Google optimized e-Paper software.
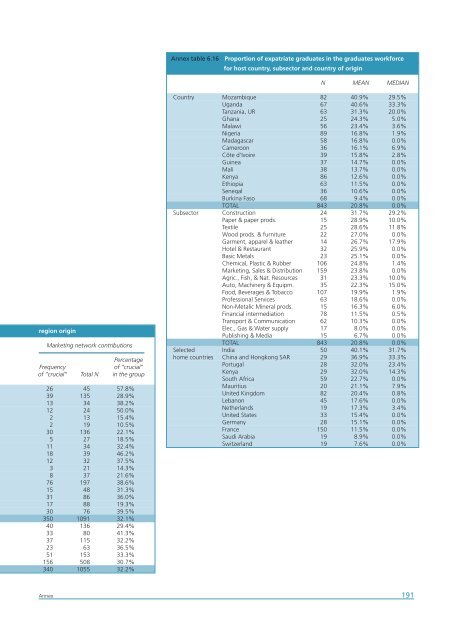
Annex table 6.16 Proportion of expatriate graduates in the graduates workforce<br />
for host country, subsector and country of origin<br />
N MEAN MEDIAN<br />
region origin<br />
Marketing network contributions<br />
Percentage<br />
Frequency<br />
of “crucial”<br />
of “crucial” Total N in the group<br />
26 45 57.8%<br />
39 135 28.9%<br />
13 34 38.2%<br />
12 24 50.0%<br />
2 13 15.4%<br />
2 19 10.5%<br />
30 136 22.1%<br />
5 27 18.5%<br />
11 34 32.4%<br />
18 39 46.2%<br />
12 32 37.5%<br />
3 21 14.3%<br />
8 37 21.6%<br />
76 197 38.6%<br />
15 48 31.3%<br />
31 86 36.0%<br />
17 88 19.3%<br />
30 76 39.5%<br />
350 1091 32.1%<br />
40 136 29.4%<br />
33 80 41.3%<br />
37 115 32.2%<br />
23 63 36.5%<br />
51 153 33.3%<br />
156 508 30.7%<br />
340 1055 32.2%<br />
Country Mozambique 82 40.9% 29.5%<br />
Uganda 67 40.6% 33.3%<br />
Tanzania, UR 63 31.3% 20.0%<br />
Ghana 25 24.3% 5.0%<br />
Malawi 56 23.4% 3.6%<br />
Nigeria 89 16.8% 1.9%<br />
Madagascar 58 16.8% 0.0%<br />
Cameroon 36 16.1% 6.9%<br />
Côte d'Ivoire 39 15.8% 2.8%<br />
Guinea 37 14.7% 0.0%<br />
Mali 38 13.7% 0.0%<br />
Kenya 86 12.6% 0.0%<br />
Ethiopia 63 11.5% 0.0%<br />
Senegal 36 10.6% 0.0%<br />
Burkina Faso 68 9.4% 0.0%<br />
TOTAL 843 20.8% 0.0%<br />
Subsector Construction 24 31.7% 29.2%<br />
Paper & paper prods. 15 28.9% 10.0%<br />
Textile 25 28.6% 11.8%<br />
Wood prods. & furniture 22 27.0% 0.0%<br />
Garment, apparel & leather 14 26.7% 17.9%<br />
Hotel & Restaurant 32 25.9% 0.0%<br />
Basic Metals 23 25.1% 0.0%<br />
Chemical, Plastic & Rubber 106 24.8% 1.4%<br />
Marketing, Sales & Distribution 159 23.8% 0.0%<br />
Agric., Fish, & Nat. Resources 31 23.3% 10.0%<br />
Auto, Machinery & Equipm. 35 22.3% 15.0%<br />
Food, Beverages & Tobacco 107 19.9% 1.9%<br />
Professional Services 63 18.6% 0.0%<br />
Non-Metalic Mineral prods. 15 16.3% 6.0%<br />
Financial intermediation 78 11.5% 0.5%<br />
Transport & Communication 62 10.3% 0.0%<br />
Elec., Gas & Water supply 17 8.0% 0.0%<br />
Publishing & Media 15 6.7% 0.0%<br />
TOTAL 843 20.8% 0.0%<br />
Selected India 50 40.1% 31.7%<br />
home countries China and Hongkong SAR 29 36.9% 33.3%<br />
Portugal 28 32.0% 23.4%<br />
Kenya 29 32.0% 14.3%<br />
South <strong>Africa</strong> 59 22.7% 0.0%<br />
Mauritius 20 21.1% 7.9%<br />
United Kingdom 82 20.4% 0.8%<br />
Lebanon 45 17.6% 0.0%<br />
Netherlands 19 17.3% 3.4%<br />
United States 33 15.4% 0.0%<br />
Germany 28 15.1% 0.0%<br />
France 150 11.5% 0.0%<br />
Saudi Arabia 19 8.9% 0.0%<br />
Switzerland 19 7.6% 0.0%<br />
Annex<br />
191