Africa Foreign Investor Survey 2005 - unido
Africa Foreign Investor Survey 2005 - unido
Africa Foreign Investor Survey 2005 - unido

You also want an ePaper? Increase the reach of your titles
YUMPU automatically turns print PDFs into web optimized ePapers that Google loves.
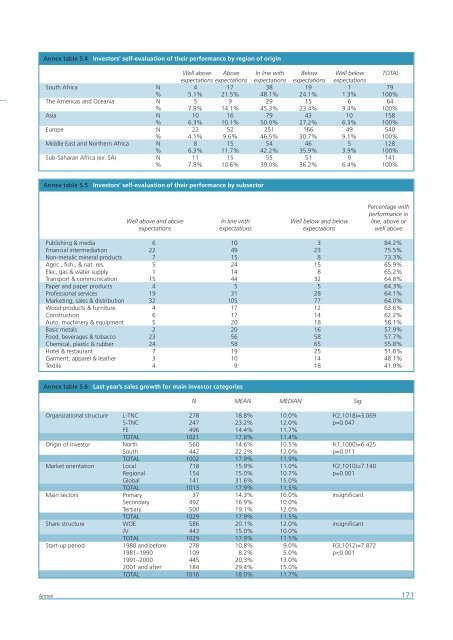
Annex table 5.4<br />
<strong>Investor</strong>s’ self-evaluation of their performance by region of origin<br />
Well above Above In line with Below Well below TOTAL<br />
expectations expectations expectations expectations expectations<br />
South <strong>Africa</strong> N 4 17 38 19 1 79<br />
% 5.1% 21.5% 48.1% 24.1% 1.3% 100%<br />
The Americas and Oceania N 5 9 29 15 6 64<br />
% 7.8% 14.1% 45.3% 23.4% 9.4% 100%<br />
Asia N 10 16 79 43 10 158<br />
% 6.3% 10.1% 50.0% 27.2% 6.3% 100%<br />
Europe N 22 52 251 166 49 540<br />
% 4.1% 9.6% 46.5% 30.7% 9.1% 100%<br />
Middle East and Northern <strong>Africa</strong> N 8 15 54 46 5 128<br />
% 6.3% 11.7% 42.2% 35.9% 3.9% 100%<br />
Sub-Saharan <strong>Africa</strong> (ex. SA) N 11 15 55 51 9 141<br />
% 7.8% 10.6% 39.0% 36.2% 6.4% 100%<br />
Annex table 5.5<br />
<strong>Investor</strong>s’ self-evaluation of their performance by subsector<br />
Percentage with<br />
performance in<br />
Well above and above In line with Well below and below line, above or<br />
expectations expectations expectations well above<br />
Publishing & media 6 10 3 84.2%<br />
Financial intermediation 22 49 23 75.5%<br />
Non-metalic mineral products 7 15 8 73.3%<br />
Agric., fish., & nat. res. 5 24 15 65.9%<br />
Elec, gas & water supply 1 14 8 65.2%<br />
Transport & communication 15 44 32 64.8%<br />
Paper and paper products 4 5 5 64.3%<br />
Professional services 19 31 28 64.1%<br />
Marketing, sales & distribution 32 105 77 64.0%<br />
Wood products & furniture 4 17 12 63.6%<br />
Construction 6 17 14 62.2%<br />
Auto, machinery & equipment 5 20 18 58.1%<br />
Basic metals 2 20 16 57.9%<br />
Food, beverages & tobacco 23 56 58 57.7%<br />
Chemical, plastic & rubber 24 58 65 55.8%<br />
Hotel & restaurant 7 19 25 51.0%<br />
Garment, apparel & leather 3 10 14 48.1%<br />
Textile 4 9 18 41.9%<br />
Annex table 5.6<br />
Last year’s sales growth for main investor categories<br />
N MEAN MEDIAN Sig.<br />
Organizational structure L-TNC 278 18.8% 10.0% F(2,1018)=3.069<br />
S-TNC 247 23.2% 12.0% p=0.047<br />
FE 496 14.4% 11.7%<br />
TOTAL 1021 17.8% 11.4%<br />
Origin of <strong>Investor</strong> North 560 14.6% 10.5% F(1,1000)=6.425<br />
South 442 22.2% 12.0% p=0.011<br />
TOTAL 1002 17.9% 11.9%<br />
Market orientation Local 718 15.9% 11.0% F(2,1010)=7.140<br />
Regional 154 15.0% 10.7% p=0.001<br />
Global 141 31.6% 15.0%<br />
TOTAL 1013 17.9% 11.5%<br />
Main sectors Primary 37 14.3% 16.0% insignificant<br />
Secondary 492 16.9% 10.0%<br />
Tertiary 500 19.1% 12.0%<br />
TOTAL 1029 17.9% 11.5%<br />
Share structure WOE 586 20.1% 12.0% insignificant<br />
JV 443 15.0% 10.0%<br />
TOTAL 1029 17.9% 11.5%<br />
Start-up period 1980 and before 278 10.8% 9.0% F(3,1012)=7.872<br />
1981–1990 109 8.2% 5.0% p