Africa Foreign Investor Survey 2005 - unido
Africa Foreign Investor Survey 2005 - unido
Africa Foreign Investor Survey 2005 - unido

You also want an ePaper? Increase the reach of your titles
YUMPU automatically turns print PDFs into web optimized ePapers that Google loves.
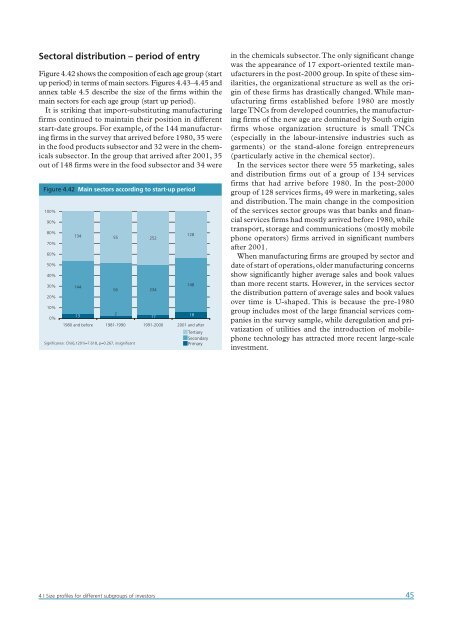
Sectoral distribution – period of entry<br />
Figure 4.42 shows the composition of each age group (start<br />
up period) in terms of main sectors. Figures 4.43–4.45 and<br />
annex table 4.5 describe the size of the firms within the<br />
main sectors for each age group (start up period).<br />
It is striking that import-substituting manufacturing<br />
firms continued to maintain their position in different<br />
start-date groups. For example, of the 144 manufacturing<br />
firms in the survey that arrived before 1980, 35 were<br />
in the food products subsector and 32 were in the chemicals<br />
subsector. In the group that arrived after 2001, 35<br />
out of 148 firms were in the food subsector and 34 were<br />
Figure 4.42 Main sectors according to start-up period<br />
100%<br />
90%<br />
80%<br />
70%<br />
60%<br />
50%<br />
40%<br />
30%<br />
20%<br />
10%<br />
0%<br />
134 55 252<br />
144<br />
13<br />
56 234<br />
2<br />
1980 and before 1981-1990 1991-2000 2001 and after<br />
Significance: Chi(6,1201)=7.618, p=0.267, insignificant<br />
17<br />
128<br />
148<br />
18<br />
Tertiary<br />
Secondary<br />
Primary<br />
in the chemicals subsector.The only significant change<br />
was the appearance of 17 export-oriented textile manufacturers<br />
in the post-2000 group. In spite of these similarities,<br />
the organizational structure as well as the origin<br />
of these firms has drastically changed. While manufacturing<br />
firms established before 1980 are mostly<br />
large TNCs from developed countries, the manufacturing<br />
firms of the new age are dominated by South origin<br />
firms whose organization structure is small TNCs<br />
(especially in the labour-intensive industries such as<br />
garments) or the stand-alone foreign entrepreneurs<br />
(particularly active in the chemical sector).<br />
In the services sector there were 55 marketing, sales<br />
and distribution firms out of a group of 134 services<br />
firms that had arrive before 1980. In the post-2000<br />
group of 128 services firms, 49 were in marketing, sales<br />
and distribution. The main change in the composition<br />
of the services sector groups was that banks and financial<br />
services firms had mostly arrived before 1980, while<br />
transport, storage and communications (mostly mobile<br />
phone operators) firms arrived in significant numbers<br />
after 2001.<br />
When manufacturing firms are grouped by sector and<br />
date of start of operations, older manufacturing concerns<br />
show significantly higher average sales and book values<br />
than more recent starts. However, in the services sector<br />
the distribution pattern of average sales and book values<br />
over time is U-shaped. This is because the pre-1980<br />
group includes most of the large financial services companies<br />
in the survey sample, while deregulation and privatization<br />
of utilities and the introduction of mobilephone<br />
technology has attracted more recent large-scale<br />
investment.<br />
4 | Size profiles for different subgroups of investors<br />
45