Africa Foreign Investor Survey 2005 - unido
Africa Foreign Investor Survey 2005 - unido
Africa Foreign Investor Survey 2005 - unido

You also want an ePaper? Increase the reach of your titles
YUMPU automatically turns print PDFs into web optimized ePapers that Google loves.
Burkina Faso and Senegalese firms were third most<br />
numerous in the Mali sample (annex table 3.3).<br />
Figures 3.17–3.18 give the sample distribution in<br />
terms of foreign share ownership.Wholly foreign owned<br />
firms (more than 90 per cent foreign owned) represent<br />
60.7 per cent of the sample and the rest are classified as<br />
joint ventures.These two classifications are further broken<br />
down into “greenfield” projects and those where the<br />
foreign investor entered through a partial or full acquisition<br />
of assets. The joint ventures are split two-to-one<br />
between greenfield and M&A and the wholly-owned<br />
firms are 80 per cent greenfield.<br />
Figure 3.19 Distribution of firms by start-up period<br />
Established<br />
2001 and after<br />
24.6%<br />
(294 cases)<br />
Established<br />
between 1991- 2000<br />
41.9%<br />
(503 cases)<br />
Established 1980<br />
and before<br />
24.1%<br />
(289 cases)<br />
Total valid cases: 1199<br />
Established<br />
between 1981-1990<br />
9.4%<br />
(113 cases)<br />
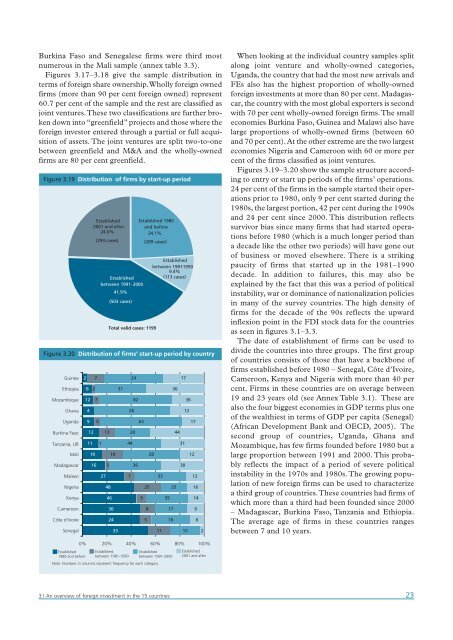
Figure 3.20 Distribution of firms’ start-up period by country<br />
Guinea<br />
Ethiopia<br />
Mozambique<br />
Ghana<br />
Uganda<br />
Burkina Faso<br />
Tanzania, UR<br />
Mali<br />
Madagascar<br />
Malawi<br />
Nigeria<br />
Kenya<br />
Cameroon<br />
Côte d'Ivoire<br />
Senegal<br />
2<br />
6<br />
12<br />
4<br />
9<br />
2<br />
10<br />
7<br />
7<br />
16<br />
5<br />
27<br />
3<br />
48<br />
46<br />
10<br />
30<br />
24<br />
33<br />
31<br />
7<br />
24<br />
26<br />
82<br />
36<br />
63<br />
12 13 28 44<br />
9<br />
25<br />
5<br />
8<br />
28<br />
33<br />
11<br />
35<br />
17<br />
16<br />
36<br />
11 1<br />
44 31<br />
25<br />
17<br />
30<br />
12<br />
15<br />
36<br />
17<br />
12<br />
12<br />
16<br />
14<br />
9<br />
6<br />
2<br />
When looking at the individual country samples split<br />
along joint venture and wholly-owned categories,<br />
Uganda, the country that had the most new arrivals and<br />
FEs also has the highest proportion of wholly-owned<br />
foreign investments at more than 80 per cent. Madagascar,<br />
the country with the most global exporters is second<br />
with 70 per cent wholly-owned foreign firms.The small<br />
economies Burkina Faso, Guinea and Malawi also have<br />
large proportions of wholly-owned firms (between 60<br />
and 70 per cent).At the other extreme are the two largest<br />
economies Nigeria and Cameroon with 60 or more per<br />
cent of the firms classified as joint ventures.<br />
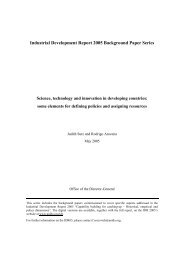
Figures 3.19–3.20 show the sample structure according<br />
to entry or start up periods of the firms’ operations.<br />
24 per cent of the firms in the sample started their operations<br />
prior to 1980, only 9 per cent started during the<br />
1980s, the largest portion, 42 per cent during the 1990s<br />
and 24 per cent since 2000. This distribution reflects<br />
survivor bias since many firms that had started operations<br />
before 1980 (which is a much longer period than<br />
a decade like the other two periods) will have gone out<br />
of business or moved elsewhere. There is a striking<br />
paucity of firms that started up in the 1981–1990<br />
decade. In addition to failures, this may also be<br />
explained by the fact that this was a period of political<br />
instability, war or dominance of nationalization policies<br />
in many of the survey countries. The high density of<br />
firms for the decade of the 90s reflects the upward<br />
inflexion point in the FDI stock data for the countries<br />
as seen in figures 3.1–3.3.<br />
The date of establishment of firms can be used to<br />
divide the countries into three groups. The first group<br />
of countries consists of those that have a backbone of<br />
firms established before 1980 – Senegal, Côte d’Ivoire,<br />
Cameroon, Kenya and Nigeria with more than 40 per<br />
cent. Firms in these countries are on average between<br />
19 and 23 years old (see Annex Table 3.1). These are<br />
also the four biggest economies in GDP terms plus one<br />
of the wealthiest in terms of GDP per capita (Senegal)<br />
(<strong>Africa</strong>n Development Bank and OECD, <strong>2005</strong>). The<br />
second group of countries, Uganda, Ghana and<br />
Mozambique, has few firms founded before 1980 but a<br />
large proportion between 1991 and 2000. This probably<br />
reflects the impact of a period of severe political<br />
instability in the 1970s and 1980s. The growing population<br />
of new foreign firms can be used to characterize<br />
a third group of countries.These countries had firms of<br />
which more than a third had been founded since 2000<br />
– Madagascar, Burkina Faso, Tanzania and Ethiopia.<br />
The average age of firms in these countries ranges<br />
between 7 and 10 years.<br />
Established<br />
1980 and before<br />
0% 20% 40% 60% 80% 100%<br />
Established<br />
between 1981-1990<br />
Established<br />
between 1991-2000<br />
Note: Numbers in columns represent frequency for each category<br />
Established<br />
2001 and after<br />
3 | An overview of foreign investment in the 15 countries<br />
23