Africa Foreign Investor Survey 2005 - unido
Africa Foreign Investor Survey 2005 - unido
Africa Foreign Investor Survey 2005 - unido

Create successful ePaper yourself
Turn your PDF publications into a flip-book with our unique Google optimized e-Paper software.
taking advantage of the opening up of economies that<br />
were previously closed to foreign investors and/or were<br />
affected by severe political instability. Others seem to be<br />
responding to the establishment of freer regional trading<br />
links, for example, the resurrection of the East <strong>Africa</strong>n<br />
Community offering easier access to member countries.<br />
Uganda and the United Republic of Tanzania appear to<br />
be particular beneficiaries. Many of the new investors<br />
originate from Kenya. Mozambique also seems to be<br />
benefiting from a catch-up process, attracting regional<br />
market seekers from Portugal and South <strong>Africa</strong>.<br />
The appearance of this new generation of regional market<br />
seeking investors suggests that it pays off for governments<br />
to reduce the risk premium for investors through<br />
improving the investment climate, and co-operating with<br />
neighbouring countries to reduce regional trade barriers.<br />
The UNIDO survey indicates that foreign entrepreneurs<br />
from around the world, including from Sub-Saharan<br />
<strong>Africa</strong> itself, respond to these opportunities.<br />
5. The fifth group of firms contains the subsidiaries<br />
of small TNCs established after 1990 to service the local<br />
market. More than forty percent originate from SSA or<br />
South <strong>Africa</strong>. Over two-thirds operate in the services sector.These<br />
firms are the second most capital intensive of<br />
the six groups and, as a reflection of this characteristic,<br />
employ the highest proportion of graduates on the payroll.<br />
However the average S-TNC subsidiary is small,<br />
employing less than 130 people.<br />
Sales achieved last year per dollar of capital invested<br />
were comparable to those of post-1990 local market-oriented<br />
L-TNC subsidiaries (Group Three) and were<br />
above the average for the whole sample.The future looks<br />
promising for this group. All relevant future growth indicators<br />
i.e. future sales, employment and investment<br />
growth are above or in keeping with the growth rates of<br />
the whole sample.<br />
6. The last group consists of foreign-owned entrepreneurial<br />
firms (FEs) without formal links to a ‘parent’.<br />
From the UNIDO survey, it would seem to be a form of<br />
enterprise governance that is ubiquitous and becoming<br />
increasingly popular in Sub-Saharan <strong>Africa</strong>, if under<br />
researched and largely ignored by policy makers.<br />
Although FEs are not controlled by a parent company<br />
through a formal governance structure, half of FEs has<br />
associated operations in other countries. Of these associated<br />
firms, some sixty percent are located exclusively in<br />
<strong>Africa</strong> and a quarter of foreign owners manage different<br />
lines of business outside the region. Eighty percent of<br />
owners from SSA or MENA operate exclusively in <strong>Africa</strong>.<br />
Half of the post-1990 FEs operate in the manufacturing<br />
sector, are small in size and operate in labour intensive sub<br />
sectors like chemicals, food and beverages and wood.<br />
Those FEs in the group operating in the services sector are<br />
about the same size as manufacturers, employing on average<br />
around a hundred people. More than forty percent of<br />
these services FEs operate in marketing, sales and distribution<br />
and a fifth provide a variety of professional services.<br />
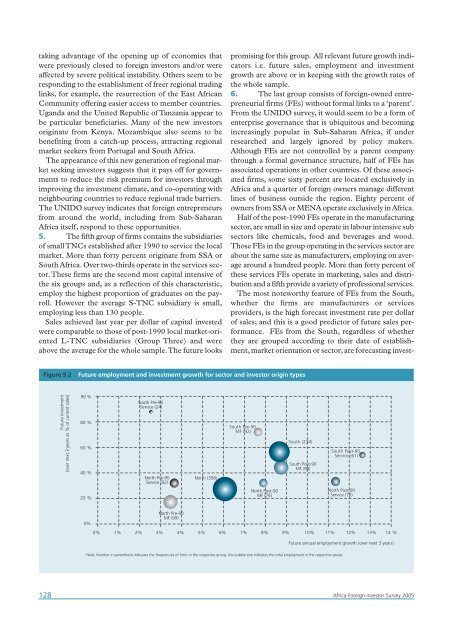
The most noteworthy feature of FEs from the South,<br />
whether the firms are manufacturers or services<br />
providers, is the high forecast investment rate per dollar<br />
of sales; and this is a good predictor of future sales performance.<br />
FEs from the South, regardless of whether<br />
they are grouped according to their date of establishment,<br />
market orientation or sector, are forecasting invest-<br />
Figure 9.2<br />
Future employment and investment growth for sector and investor origin types<br />
Future investment<br />
(over next 3 years as % of current sales)<br />
90 %<br />
80 %<br />
60 %<br />
40 %<br />
20 %<br />
South Pre-90<br />
Service (24)<br />
North Pre-90<br />
Service (92)<br />
North (358)<br />
South Pre-90<br />
MF (42)<br />
North Post-90<br />
MF (76)<br />
South (234)<br />
South Post-90<br />
MF (98)<br />
South Post-90<br />
Service (61)<br />
North Post-90<br />
Service (70)<br />
0%<br />
North Pre-90<br />
MF (99)<br />
0% 1% 2% 3% 4% 5% 6% 7% 8% 9% 10% 11% 12% 13% 14 %<br />
Future annual employment growth (over next 3 years)<br />
Note: Number in parenthesis indicates the frequencies of firms in the respective group, the bubble size indicates the total employment in the respective group<br />
128 <strong>Africa</strong> <strong>Foreign</strong> <strong>Investor</strong> <strong>Survey</strong> <strong>2005</strong>