Africa Foreign Investor Survey 2005 - unido
Africa Foreign Investor Survey 2005 - unido
Africa Foreign Investor Survey 2005 - unido

Create successful ePaper yourself
Turn your PDF publications into a flip-book with our unique Google optimized e-Paper software.
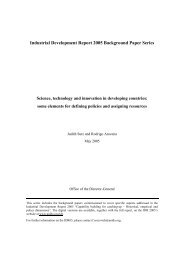
majority of firms global exporters (more than 50 per<br />
cent). Two of the countries, Côte d’Ivoire and Kenya,<br />
might be considered to be entrepôt economies, supplying<br />
neighbouring land-locked countries with consumer<br />
goods (as a result of historical structures). This is also<br />
reflected, as shown earlier in table 3.2, by the fact that<br />
the dominating subsectors in these two countries are<br />
marketing, sales and distribution, which, in the case of<br />
Kenya, accounts for almost one third of the country<br />
sample. About 30 per cent of the companies in Côte<br />
d’Ivoire and Kenya are regional exporters. Senegal<br />
occupies a similar position – nearly 30 per cent of firms<br />
in the country sample were exporting to regional markets.<br />
However unlike Côte d’Ivoire and Kenya, Senegal<br />
has few globally-oriented exporters. It is also striking<br />
that all three countries were themselves significant<br />
sources of foreign firms operating in neighbouring<br />
countries – Kenya with 38, Côte d’Ivoire with 18 and<br />
Senegal with 11 firms in the survey sample (annex table<br />
3.2). Indeed, firms of Kenyan origin were the most<br />
numerous of foreign firms located in the United<br />
Republic of Tanzania and second most numerous in the<br />
Uganda sample, while Côte d’Ivoire firms were third in<br />
Figure 3.15 Distribution of market orientation<br />
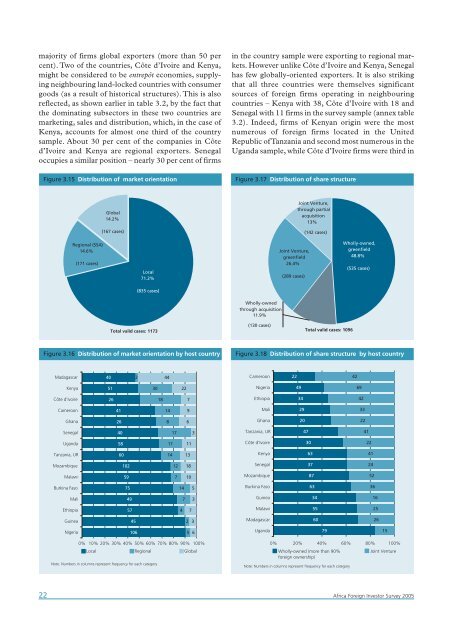
Figure 3.17 Distribution of share structure<br />
Global<br />
14.2%<br />
(167 cases)<br />
Joint Venture,<br />
through partial<br />
acquisition<br />
13%<br />
(142 cases)<br />
Regional (SSA)<br />
14.6%<br />
(171 cases)<br />
Local<br />
71.2%<br />
Joint Venture,<br />
greenfield<br />
26.4%<br />
(289 cases)<br />
Wholly-owned,<br />
greenfiel d<br />
48.8%<br />
(535 cases)<br />
(835 cases)<br />
Wholly-owned<br />
through acquisition<br />
11.9%<br />
Total valid cases: 1173<br />
(130 cases)<br />
Total valid cases: 1096<br />
Figure 3.16 Distribution of market orientation by host country<br />
Figure 3.18 Distribution of share structure by host country<br />
Madagascar<br />
40<br />
2<br />
44<br />
Cameroon<br />
22<br />
42<br />
Kenya<br />
51<br />
30<br />
22<br />
Nigeria<br />
49<br />
69<br />
Côte d'Ivoire<br />
26<br />
18<br />
7<br />
Ethiopia<br />
34<br />
42<br />
Cameroon<br />
41<br />
14<br />
9<br />
Mali<br />
29<br />
33<br />
Ghana<br />
26<br />
8<br />
6<br />
Ghana<br />
20<br />
22<br />
Senegal<br />
40<br />
17<br />
3<br />
Tanzania, UR<br />
47<br />
41<br />
Uganda<br />
58<br />
17<br />
11<br />
Côte d'Ivoire<br />
30<br />
22<br />
Tanzania, UR<br />
60<br />
14<br />
13<br />
Kenya<br />
63<br />
41<br />
Mozambique<br />
102<br />
12<br />
18<br />
Senegal<br />
37<br />
24<br />
Malawi<br />
59<br />
7<br />
10<br />
Mozambique<br />
87<br />
52<br />
Burkina Faso<br />
75<br />
14<br />
5<br />
Burkina Faso<br />
63<br />
36<br />
Mali<br />
49<br />
7<br />
3<br />
Guinea<br />
34<br />
16<br />
Ethiopia<br />
57<br />
4<br />
7<br />
Malawi<br />
55<br />
25<br />
Guinea<br />
45<br />
2<br />
3<br />
Madagascar<br />
60<br />
26<br />
Nigeria<br />
106<br />
5 6<br />
Uganda<br />
79<br />
15<br />
0% 10% 20% 30% 40% 50% 60% 70% 80% 90% 100%<br />
Local Regional Global<br />
Note: Numbers in columns represent frequency for each category<br />
0% 20% 40% 60% 80% 100%<br />
Wholly-owned (more than 90%<br />
Joint Venture<br />
foreign ownership)<br />
Note: Numbers in columns represent frequency for each category<br />
22 <strong>Africa</strong> <strong>Foreign</strong> <strong>Investor</strong> <strong>Survey</strong> <strong>2005</strong>