Africa Foreign Investor Survey 2005 - unido
Africa Foreign Investor Survey 2005 - unido
Africa Foreign Investor Survey 2005 - unido
You also want an ePaper? Increase the reach of your titles
YUMPU automatically turns print PDFs into web optimized ePapers that Google loves.
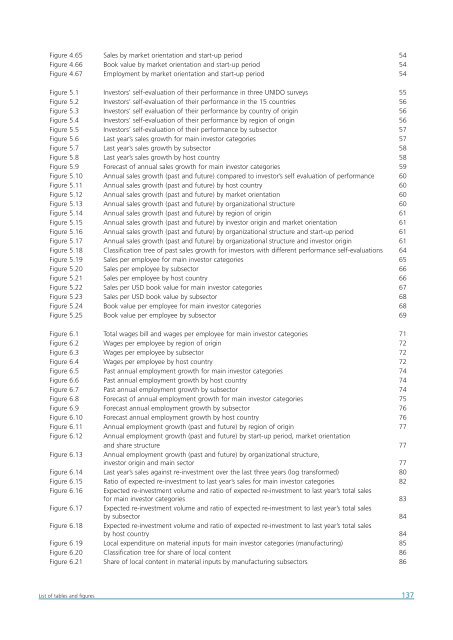
Figure 4.65 Sales by market orientation and start-up period 54<br />
Figure 4.66 Book value by market orientation and start-up period 54<br />
Figure 4.67 Employment by market orientation and start-up period 54<br />
Figure 5.1 <strong>Investor</strong>s' self-evaluation of their performance in three UNIDO surveys 55<br />
Figure 5.2 <strong>Investor</strong>s’ self-evaluation of their performance in the 15 countries 56<br />
Figure 5.3 <strong>Investor</strong>s’ self evaluation of their performance by country of origin 56<br />
Figure 5.4 <strong>Investor</strong>s’ self-evaluation of their performance by region of origin 56<br />
Figure 5.5 <strong>Investor</strong>s’ self-evaluation of their performance by subsector 57<br />
Figure 5.6 Last year’s sales growth for main investor categories 57<br />
Figure 5.7 Last year’s sales growth by subsector 58<br />
Figure 5.8 Last year’s sales growth by host country 58<br />
Figure 5.9 Forecast of annual sales growth for main investor categories 59<br />
Figure 5.10 Annual sales growth (past and future) compared to investor’s self evaluation of performance 60<br />
Figure 5.11 Annual sales growth (past and future) by host country 60<br />
Figure 5.12 Annual sales growth (past and future) by market orientation 60<br />
Figure 5.13 Annual sales growth (past and future) by organizational structure 60<br />
Figure 5.14 Annual sales growth (past and future) by region of origin 61<br />
Figure 5.15 Annual sales growth (past and future) by investor origin and market orientation 61<br />
Figure 5.16 Annual sales growth (past and future) by organizational structure and start-up period 61<br />
Figure 5.17 Annual sales growth (past and future) by organizational structure and investor origin 61<br />
Figure 5.18 Classification tree of past sales growth for investors with different performance self-evaluations 64<br />
Figure 5.19 Sales per employee for main investor categories 65<br />
Figure 5.20 Sales per employee by subsector 66<br />
Figure 5.21 Sales per employee by host country 66<br />
Figure 5.22 Sales per USD book value for main investor categories 67<br />
Figure 5.23 Sales per USD book value by subsector 68<br />
Figure 5.24 Book value per employee for main investor categories 68<br />
Figure 5.25 Book value per employee by subsector 69<br />
Figure 6.1 Total wages bill and wages per employee for main investor categories 71<br />
Figure 6.2 Wages per employee by region of origin 72<br />
Figure 6.3 Wages per employee by subsector 72<br />
Figure 6.4 Wages per employee by host country 72<br />
Figure 6.5 Past annual employment growth for main investor categories 74<br />
Figure 6.6 Past annual employment growth by host country 74<br />
Figure 6.7 Past annual employment growth by subsector 74<br />
Figure 6.8 Forecast of annual employment growth for main investor categories 75<br />
Figure 6.9 Forecast annual employment growth by subsector 76<br />
Figure 6.10 Forecast annual employment growth by host country 76<br />
Figure 6.11 Annual employment growth (past and future) by region of origin 77<br />
Figure 6.12 Annual employment growth (past and future) by start-up period, market orientation<br />
and share structure 77<br />
Figure 6.13 Annual employment growth (past and future) by organizational structure,<br />
investor origin and main sector 77<br />
Figure 6.14 Last year’s sales against re-investment over the last three years (log transformed) 80<br />
Figure 6.15 Ratio of expected re-investment to last year’s sales for main investor categories 82<br />
Figure 6.16 Expected re-investment volume and ratio of expected re-investment to last year’s total sales<br />
for main investor categories 83<br />
Figure 6.17 Expected re-investment volume and ratio of expected re-investment to last year’s total sales<br />
by subsector 84<br />
Figure 6.18 Expected re-investment volume and ratio of expected re-investment to last year’s total sales<br />
by host country 84<br />
Figure 6.19 Local expenditure on material inputs for main investor categories (manufacturing) 85<br />
Figure 6.20 Classification tree for share of local content 86<br />
Figure 6.21 Share of local content in material inputs by manufacturing subsectors 86<br />
List of tables and figures<br />
137


