

Analysis - The Institute for Southern Studies
Analysis - The Institute for Southern Studies
Analysis - The Institute for Southern Studies

Create successful ePaper yourself
Turn your PDF publications into a flip-book with our unique Google optimized e-Paper software.
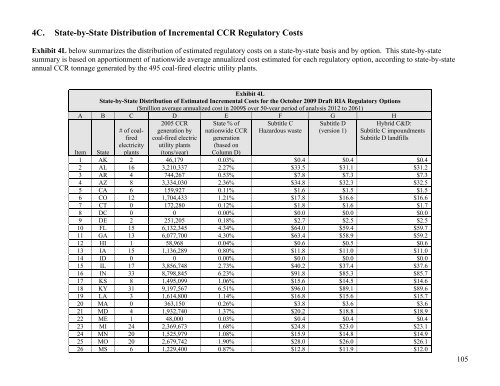
4C. State-by-State Distribution of Incremental CCR Regulatory Costs<br />
Exhibit 4L below summarizes the distribution of estimated regulatory costs on a state-by-state basis and by option. This state-by-state<br />
summary is based on apportionment of nationwide average annualized cost estimated <strong>for</strong> each regulatory option, according to state-by-state<br />
annual CCR tonnage generated by the 495 coal-fired electric utility plants.<br />
Exhibit 4L<br />
State-by-State Distribution of Estimated Incremental Costs <strong>for</strong> the October 2009 Draft RIA Regulatory Options<br />
($million average annualized cost in 2009$ over 50-year period of analysis 2012 to 2061)<br />
A B C D E F G H<br />
# of coalfired<br />
electricity<br />
plants<br />
2005 CCR<br />
generation by<br />
coal-fired electric<br />
utility plants<br />
(tons/year)<br />
State % of<br />
nationwide CCR<br />
generation<br />
(based on<br />
Column D)<br />
Subtitle C<br />
Hazardous waste<br />
Subtitle D<br />
(version 1)<br />
Hybrid C&D:<br />
Subtitle C impoundments<br />
Subtitle D landfills<br />
Item State<br />
1 AK 2 46,179 0.03% $0.4 $0.4 $0.4<br />
2 AL 16 3,210,337 2.27% $33.5 $31.1 $31.2<br />
3 AR 4 744,267 0.53% $7.8 $7.3 $7.3<br />
4 AZ 8 3,334,030 2.36% $34.8 $32.3 $32.5<br />
5 CA 6 159,927 0.11% $1.6 $1.5 $1.5<br />
6 CO 12 1,704,433 1.21% $17.8 $16.6 $16.6<br />
7 CT 0 172,280 0.12% $1.8 $1.6 $1.7<br />
8 DC 0 0 0.00% $0.0 $0.0 $0.0<br />
9 DE 2 251,205 0.18% $2.7 $2.5 $2.5<br />
10 FL 15 6,132,345 4.34% $64.0 $59.4 $59.7<br />
11 GA 13 6,077,700 4.30% $63.4 $58.9 $59.2<br />
12 HI 1 58,968 0.04% $0.6 $0.5 $0.6<br />
13 IA 15 1,136,289 0.80% $11.8 $11.0 $11.0<br />
14 ID 0 0 0.00% $0.0 $0.0 $0.0<br />
15 IL 17 3,856,748 2.73% $40.2 $37.4 $37.6<br />
16 IN 33 8,798,845 6.23% $91.8 $85.3 $85.7<br />
17 KS 8 1,495,099 1.06% $15.6 $14.5 $14.6<br />
18 KY 31 9,197,567 6.51% $96.0 $89.1 $89.6<br />
19 LA 3 1,614,800 1.14% $16.8 $15.6 $15.7<br />
20 MA 0 363,150 0.26% $3.8 $3.6 $3.6<br />
21 MD 4 1,932,740 1.37% $20.2 $18.8 $18.9<br />
22 ME 1 48,000 0.03% $0.4 $0.4 $0.4<br />
23 MI 24 2,369,673 1.68% $24.8 $23.0 $23.1<br />
24 MN 20 1,525,979 1.08% $15.9 $14.8 $14.9<br />
25 MO 20 2,679,742 1.90% $28.0 $26.0 $26.1<br />
26 MS 6 1,229,400 0.87% $12.8 $11.9 $12.0<br />
105

