

Analysis - The Institute for Southern Studies
Analysis - The Institute for Southern Studies
Analysis - The Institute for Southern Studies

You also want an ePaper? Increase the reach of your titles
YUMPU automatically turns print PDFs into web optimized ePapers that Google loves.
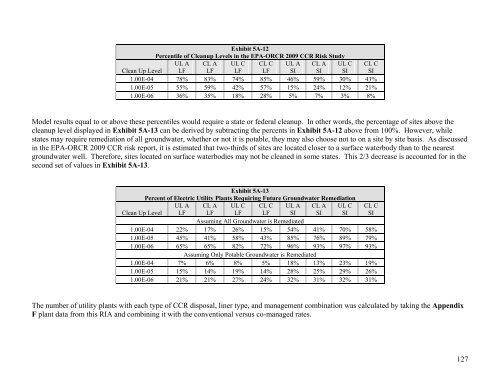
Exhibit 5A-12<br />
Percentile of Cleanup Levels in the EPA-ORCR 2009 CCR Risk Study<br />
Clean Up Level<br />
UL A<br />
LF<br />
CL A<br />
LF<br />
UL C<br />
LF<br />
CL C<br />
LF<br />
UL A<br />
SI<br />
CL A<br />
SI<br />
UL C<br />
SI<br />
CL C<br />
SI<br />
1.00E-04 78% 83% 74% 85% 46% 59% 30% 43%<br />
1.00E-05 55% 59% 42% 57% 15% 24% 12% 21%<br />
1.00E-06 36% 35% 18% 28% 5% 7% 3% 8%<br />
Model results equal to or above these percentiles would require a state or federal cleanup. In other words, the percentage of sites above the<br />
cleanup level displayed in Exhibit 5A-13 can be derived by subtracting the percents in Exhibit 5A-12 above from 100%. However, while<br />
states may require remediation of all groundwater, whether or not it is potable, they may also choose not to on a site by site basis. As discussed<br />
in the EPA-ORCR 2009 CCR risk report, it is estimated that two-thirds of sites are located closer to a surface waterbody than to the nearest<br />
groundwater well. <strong>The</strong>re<strong>for</strong>e, sites located on surface waterbodies may not be cleaned in some states. This 2/3 decrease is accounted <strong>for</strong> in the<br />
second set of values in Exhibit 5A-13.<br />
Exhibit 5A-13<br />
Percent of Electric Utility Plants Requiring Future Groundwater Remediation<br />
Clean Up Level<br />
UL A<br />
LF<br />
CL A<br />
LF<br />
UL C<br />
LF<br />
CL C<br />
LF<br />
UL A<br />
SI<br />
CL A<br />
SI<br />
UL C<br />
SI<br />
CL C<br />
SI<br />
Assuming All Groundwater is Remediated<br />
1.00E-04 22% 17% 26% 15% 54% 41% 70% 58%<br />
1.00E-05 45% 41% 58% 43% 85% 76% 89% 79%<br />
1.00E-06 65% 65% 82% 72% 96% 93% 97% 93%<br />
Assuming Only Potable Groundwater is Remediated<br />
1.00E-04 7% 6% 8% 5% 18% 13% 23% 19%<br />
1.00E-05 15% 14% 19% 14% 28% 25% 29% 26%<br />
1.00E-06 21% 21% 27% 24% 32% 31% 32% 31%<br />
<strong>The</strong> number of utility plants with each type of CCR disposal, liner type, and management combination was calculated by taking the Appendix<br />
F plant data from this RIA and combining it with the conventional versus co-managed rates.<br />
127

