

Beauheim 1987 - Waste Isolation Pilot Plant - U.S. Department of ...
Beauheim 1987 - Waste Isolation Pilot Plant - U.S. Department of ...
Beauheim 1987 - Waste Isolation Pilot Plant - U.S. Department of ...

Create successful ePaper yourself
Turn your PDF publications into a flip-book with our unique Google optimized e-Paper software.
was followed by a 92-minute FBU. The SFL lasted<br />
about 32 minutes, and was followed by a SBU almost<br />
16 hr long. To obtain equivalent constant-rate flow<br />
periods, each <strong>of</strong> the flow periods was divided into<br />
two shorter periods. The FFL was divided into two<br />
periods with flow rates <strong>of</strong> 0.028 and 0.021 gpm, and<br />
the SFL was divided into periods with flow rates <strong>of</strong><br />
0.022 and 0.017 gpm (Table 5-1). The slug test<br />
lasted slightly over 6 hr, by which time about 57% <strong>of</strong><br />
the induced pressure differential had dissipated.<br />
Overpressureskin effects were apparent during the<br />
Forty-niner claystone testing, just as they were<br />
during all other testing at H-14. The fluid pressure<br />
reached a maximum <strong>of</strong> 67.9 psia during the initial<br />
equilibration period, was essentially constant at<br />
66.8 psia at the end <strong>of</strong> the FBU, and peaked at<br />
66.2 psia during the SBU (Figure 5-95). The<br />
superposition <strong>of</strong> pressure-skin effects manifested in<br />
the Magenta test data (see Section 5.2.4.1) was not<br />
apparent, however, in the Forty-niner claystone test<br />
data.<br />
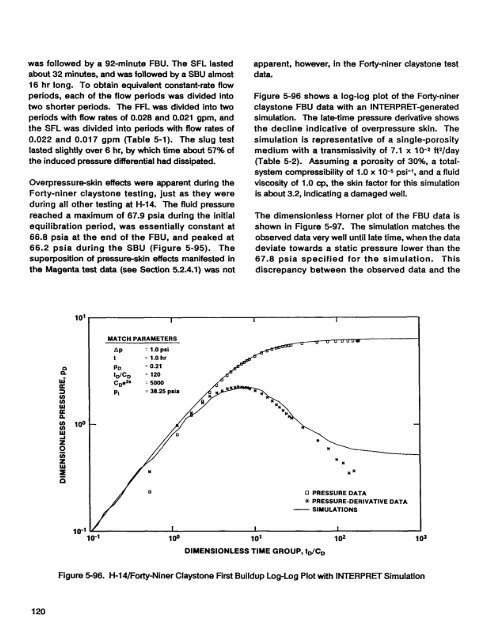
Figure 5-96 shows a log-log plot <strong>of</strong> the Forty-niner<br />
claystone FBU data with an INTERPRET-generated<br />
simulation. The late-time pressure derivative shows<br />
the decline indicative <strong>of</strong> overpressure skin. The<br />
simulation is representative <strong>of</strong> a single-porosity<br />
medium with a transmissivity <strong>of</strong> 7.1 x 10⁻² ftzjday<br />
(Table 5-2). Assuming a porosity <strong>of</strong> 30%, a totalsystem<br />
compressibility <strong>of</strong> 1.0 x 10⁻⁵ psi-', and a fluid<br />
viscosity <strong>of</strong> 1.0 cp, the skin factor for this simulation<br />
is about 3.2, indicating a damaged well.<br />
The dimensionless Horner plot <strong>of</strong> the FEU data is<br />
shown in Figure 5-97. The simulation matches the<br />
observed data very well until late time, when the data<br />
deviate towards a static pressure lower than the<br />
67.8 psia specified for the simulation. This<br />
discrepancy between the observed data and the<br />
10'<br />
0<br />
n<br />
w'<br />
a 3<br />
v)<br />
v)<br />
w<br />
a<br />
n<br />
2 100<br />
W<br />
4<br />
2<br />
2<br />
v)<br />
2<br />
w<br />
s<br />
5<br />
MATCH PARAMETERS<br />
AP<br />
= 1.0 psi<br />
t<br />
= 1.0 hr<br />
PO = 0.21<br />
tdc, = 120<br />
Cge2. = 5000<br />
**<br />
0 PRESSURE DATA<br />
* PRESSURE-DERIVATIVE DATA<br />
- SIMULATIONS<br />
10'<br />
100 10' 102<br />
DIMENSIONLESS TIME GROUP, tdC,<br />
103<br />
Figure 596. H-l4/Forty-Niner Claystone First Buildup Log-Log Plot with INTERPRET Simulation<br />
120


