

Beauheim 1987 - Waste Isolation Pilot Plant - U.S. Department of ...
Beauheim 1987 - Waste Isolation Pilot Plant - U.S. Department of ...
Beauheim 1987 - Waste Isolation Pilot Plant - U.S. Department of ...

Create successful ePaper yourself
Turn your PDF publications into a flip-book with our unique Google optimized e-Paper software.
EI€3- 0.9 "O<br />
I OOATA<br />
- TYPE CURVE I I<br />
--- I<br />
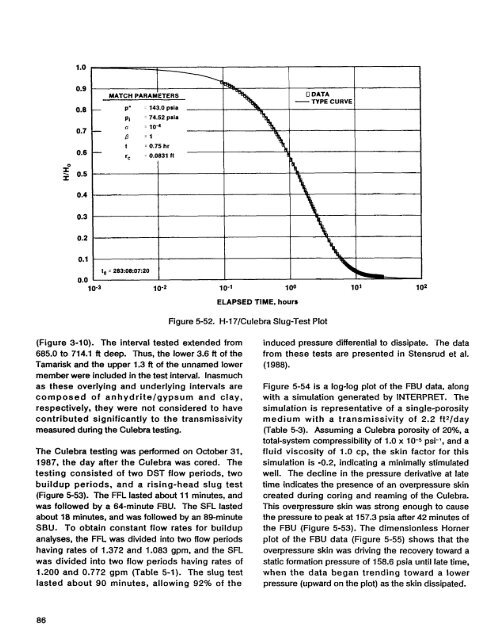
MATCH PARAMETERS<br />
ELAPSED TIME, hours<br />
Figure 5-52. H-17lCulebra Slug-Test Plot<br />
(Figure 3-10). The interval tested extended from<br />
685.0 to 714.1 ft deep. Thus, the lower 3.6 ft <strong>of</strong> the<br />
Tamarisk and the upper 1.3 ft <strong>of</strong> the unnamed lower<br />
member were included in the test interval. Inasmuch<br />
as these overlying and underlying intervals are<br />
composed <strong>of</strong> anhydrite/gypsum and clay,<br />
respectively, they were not considered to have<br />
contributed significantly to the transmissivity<br />
measured during the Culebra testing.<br />
The Culebra testing was performed on October 31,<br />
<strong>1987</strong>, the day after the Culebra was cored. The<br />
testing consisted <strong>of</strong> two DST flow periods, two<br />
buildup periods, and a rising-head slug test<br />
(Figure 5-53). The FFL lasted about 11 minutes, and<br />
was followed by a 64-minute FBU. The SFL lasted<br />
about 18 minutes, and was followed by an 89-minute<br />
SBU. To obtain constant flow rates for buildup<br />
analyses, the FFL was divided into two flow periods<br />
having rates <strong>of</strong> 1.372 and 1.083 gpm, and the SFL<br />
was divided into two flow periods having rates <strong>of</strong><br />
1.200 and 0.772 gpm (Table 5-1). The slug test<br />
lasted about 90 minutes, allowing 92% <strong>of</strong> the<br />
induced pressure differential to dissipate. The data<br />
from these tests are presented in Stensrud et al.<br />
(1 988).<br />
Figure 5-54 is a log-log plot <strong>of</strong> the FBU data, along<br />
with a simulation generated by INTERPRET. The<br />
simulation is representative <strong>of</strong> a single-porosity<br />
medium with a transmissivity <strong>of</strong> 2.2 ftzfday<br />
(Table 5-3). Assuming a Culebra porosity <strong>of</strong> 20%, a<br />
total-system compressibility <strong>of</strong> 1.0 x 10⁻⁵ psi-', and a<br />
fluid viscosity <strong>of</strong> 1.0 cp, the skin factor for this<br />
simulation is -0.2, indicating a minimally stimulated<br />
well. The decline in the pressure derivative at late<br />
time indicates the presence <strong>of</strong> an overpressure skin<br />
created during coring and reaming <strong>of</strong> the Culebra.<br />
This overpressure skin was strong enough to cause<br />
the pressure to peak at 157.3 psia after 42 minutes <strong>of</strong><br />
the FBU (Figure 5-53). The dimensionless Horner<br />
plot <strong>of</strong> the FBU data (Figure 5-55) shows that the<br />
overpressure skin was driving the recovery toward a<br />
static formation pressure <strong>of</strong> 158.6 psia until late time,<br />
when the data began trending toward a lower<br />
pressure (upward on the plot) as the skin dissipated.<br />
86


