

Beauheim 1987 - Waste Isolation Pilot Plant - U.S. Department of ...
Beauheim 1987 - Waste Isolation Pilot Plant - U.S. Department of ...
Beauheim 1987 - Waste Isolation Pilot Plant - U.S. Department of ...

Create successful ePaper yourself
Turn your PDF publications into a flip-book with our unique Google optimized e-Paper software.
10’<br />
1 I I<br />
n<br />
ui<br />
a<br />
3<br />
v)<br />
v)<br />
W<br />
K<br />
n<br />
MATCH PARAMETERS<br />
AP<br />
= 1.0 psi<br />
t<br />
= 1.0 hr<br />
PO 0.082<br />
tDKD = 500<br />
CDeZ5 = 3000<br />
PI<br />
= 62.0 psia<br />
D PRESSURE DATA<br />
-% PRESSURE-DERIVATIVE DATA<br />
- SIMULATIONS<br />
1<br />
100 IO’ 102 103<br />
DIMENSIONLESS TIME GROUP, tD/CD<br />
104<br />
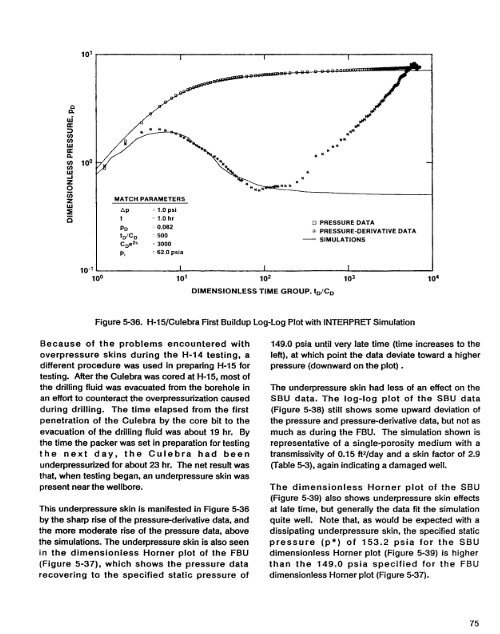
Figure 5-36. H-l5/Culebra First Buildup Log-Log Plot with INTERPRET Simulation<br />
Because <strong>of</strong> the problems encountered with<br />
overpressure skins during the H-14 testing, a<br />
different procedure was used in preparing H-15 for<br />
testing. After the Culebra was cored at H-15, most <strong>of</strong><br />
the drilling fluid was evacuated from the borehole in<br />
an effort to counteract the overpressurization caused<br />
during drilling. The time elapsed from the first<br />
penetration <strong>of</strong> the Culebra by the core bit to the<br />
evacuation <strong>of</strong> the drilling fluid was about 19 hr. By<br />
the time the packer was set in preparation for testing<br />
the next day, the Culebra had been<br />
underpressurized for about 23 hr. The net result was<br />
that, when testing began, an underpressure skin was<br />
present near the wellbore.<br />
This underpressure skin is manifested in Figure 5-36<br />
by the sharp rise <strong>of</strong> the pressure-derivative data, and<br />
the more moderate rise <strong>of</strong> the pressure data, above<br />
the simulations. The underpressure skin is also seen<br />
in the dimensionless Horner plot <strong>of</strong> the FBU<br />
(Figure 5-37), which shows the pressure data<br />
recovering to the specified static pressure <strong>of</strong><br />
149.0 psia until very late time (time increases to the<br />
left), at which point the data deviate toward a higher<br />
pressure (downward on the plot) .<br />
The underpressure skin had less <strong>of</strong> an effect on the<br />
SBU data. The log-log plot <strong>of</strong> the SBU data<br />
(Figure 5-38) still shows some upward deviation <strong>of</strong><br />
the pressure and pressure-derivative data, but not as<br />
much as during the FBU. The simulation shown is<br />
representative <strong>of</strong> a single-porosity medium with a<br />
transmissivity <strong>of</strong> 0.15 ft2lday and a skin factor <strong>of</strong> 2.9<br />
(Table 5-3), again indicating a damaged well.<br />
The dimensionless Horner plot <strong>of</strong> the SBU<br />
(Figure 5-39) also shows underpressure skin effects<br />
at late time, but generally the data fit the simulation<br />
quite well. Note that, as would be expected with a<br />
dissipating underpressure skin, the specified static<br />
pressure (p*) <strong>of</strong> 153.2 psia for the SBU<br />
dimensionless Horner plot (Figure 5-39) is higher<br />
than the 149.0 psia specified for the FBU<br />
dimensionless Horner plot (Figure 5-37).<br />
75


