

Beauheim 1987 - Waste Isolation Pilot Plant - U.S. Department of ...
Beauheim 1987 - Waste Isolation Pilot Plant - U.S. Department of ...
Beauheim 1987 - Waste Isolation Pilot Plant - U.S. Department of ...

Create successful ePaper yourself
Turn your PDF publications into a flip-book with our unique Google optimized e-Paper software.
4.0<br />
MATCH PARAMETERS<br />
.A. L.<br />
21%<br />
3.0<br />
.<br />
Y<br />
n<br />
: 2.0<br />
n<br />
AP<br />
= 1.0 psi<br />
t<br />
= 1.0 hr<br />
PO = 0.064<br />
tdC, =14<br />
P*<br />
1 .o<br />
+ DATA<br />
- SIMULATION<br />
I<br />
I<br />
0.0 --- 0.0 1 .o 2.0 3.0<br />
DIMENSIONLESS SUPERPOSITION FUNCTION: FLOW PERIOD 3<br />
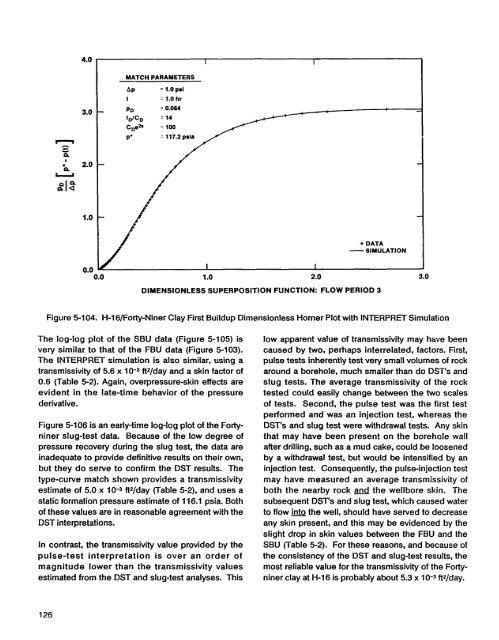
Figure 5-1 04. H-1 G/Forty-Niner Clay First Buildup Dimensionless Horner Plot with INTERPRET Simulation<br />
The log-log plot <strong>of</strong> the SBU data (Figure 5-105) is<br />
very similar to that <strong>of</strong> the FBU data (Figure 5-103).<br />
The INTERPRET simulation is also similar, using a<br />
transmissivity <strong>of</strong> 5.6 x 10⁻³ ftz/day and a skin factor <strong>of</strong><br />
0.6 (Table 5-2). Again, overpressure-skin effects are<br />
evident in the late-time behavior <strong>of</strong> the pressure<br />
derivative.<br />
Figure 5-1 06 is an early-time log-log plot <strong>of</strong> the Fortyniner<br />
slug-test data. Because <strong>of</strong> the low degree <strong>of</strong><br />
pressure recovery during the slug test, the data are<br />
inadequate to provide definitive results on their own,<br />
but they do serve to confirm the DST results. The<br />
type-curve match shown provides a transmissivity<br />
estimate <strong>of</strong> 5.0 x 10⁻³ ft*/day (Table 5-2), and uses a<br />
static formation pressure estimate <strong>of</strong> 116.1 psia. Both<br />
<strong>of</strong> these values are in reasonable agreement with the<br />
DST interpretations.<br />
In contrast, the transmissivity value provided by the<br />
pulse-test interpretation is over an order <strong>of</strong><br />
magnitude lower than the transmissivity values<br />
estimated from the DST and slug-test analyses. This<br />
low apparent value <strong>of</strong> transmissivity may hwe been<br />
caused by two, perhaps interrelated, factors. First,<br />
pulse tests inherently test very small volumes <strong>of</strong> rock<br />
around a borehole, much smaller than do DST's and<br />
slug tests. The average transmissivity <strong>of</strong> the rock<br />
tested could easily change between the two scales<br />
<strong>of</strong> tests. Second, the pulse test was the first test<br />
performed and was an injection test, whereas the<br />
DST's and slug test were withdrawal tests. Any skin<br />
that may have been present on the borehole wall<br />
after drilling, such as a mud cake, could be loosened<br />
by a withdrawal test, but would be intensified by an<br />
injection test. Consequently, the pulse-injection test<br />
may have measured an average transmissivity <strong>of</strong><br />
both the nearby rock and the wellbore skin. The<br />
subsequent DST's and slug test, which caused water<br />
to flow into the well, should have served to decrease<br />
any skin present, and this may be evidenced by the<br />
slight drop in skin values between the FBU and the<br />
SBU (Table 5-2). For these reasons, and because <strong>of</strong><br />
the consistency <strong>of</strong> the DST and slug-test results, the<br />
most reliable value for the transmissivity <strong>of</strong> the Fortyniner<br />
clay at H-16 is probably about 5.3 x 10⁻³ ftz/day.<br />
126


