

Beauheim 1987 - Waste Isolation Pilot Plant - U.S. Department of ...
Beauheim 1987 - Waste Isolation Pilot Plant - U.S. Department of ...
Beauheim 1987 - Waste Isolation Pilot Plant - U.S. Department of ...

You also want an ePaper? Increase the reach of your titles
YUMPU automatically turns print PDFs into web optimized ePapers that Google loves.
Just before the minipacker was deflated on<br />
November 6,<strong>1987</strong>, the transducer, located at a depth<br />
<strong>of</strong> 778.22 ft, measured a pressure <strong>of</strong> 110.9 psig. After<br />
the packer was deflated and just before it was<br />
removed from the tubing, the pressure was<br />
43.15 psig. If the water above the transducer had a<br />
specific gravity <strong>of</strong> 1.05, a pressure <strong>of</strong> 43.15 psig<br />
would correspond to a water level about 683.4 ft<br />
deep. The first water-level measurement made after<br />
the minipacker was removed, however, showed a<br />
depth to water <strong>of</strong> 690.2 ft. Extrapolation <strong>of</strong> the first<br />
few water-level measurements back to the time when<br />
the minipacker was deflated indicate that the initial<br />
water level was probably about 690.9 ft deep. This<br />
extrapolation indicates that either the water in the<br />
tubing had a specific gravity <strong>of</strong> 1.14, or that the<br />
transducer was actually about 7.5 ft deeper than was<br />
thought. Because greater confidence was placed in<br />
the specific-gravity measurements made when the<br />
tubing was last bailed than in the transducer-depth<br />
measurement, the recorded transducer depth was<br />
assumed to be incorrect. With the transducer 7.5 ft<br />
deeper, the pre-test "static" pressure <strong>of</strong> 110.9 psig<br />
would correspond to a depth to water <strong>of</strong> about<br />
542.0 ft. Accordingly, an initial depth to water <strong>of</strong><br />
(DTW,) 690.9 ft and a static depth to water (DTW*) <strong>of</strong><br />
542.0 ft were used in interpreting the P-18 slug test.<br />
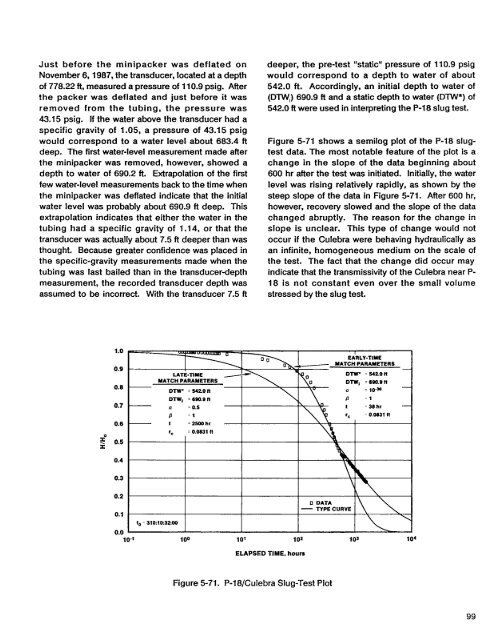
Figure 5-71 shows a semilog plot <strong>of</strong> the P-18 slugtest<br />
data. The most notable feature <strong>of</strong> the plot is a<br />
change in the slope <strong>of</strong> the data beginning about<br />
600 hr after the test was initiated. Initially, the water<br />
level was rising relatively rapidly, as shown by the<br />
steep slope <strong>of</strong> the data in Figure 5-71. After 600 hr,<br />
however, recovery slowed and the slope <strong>of</strong> the data<br />
changed abruptly. The reason for the change in<br />
slope is unclear. This type <strong>of</strong> change would not<br />
occur if the Culebra were behaving hydraulically as<br />
an infinite, homogeneous medium on the scale <strong>of</strong><br />
the test. The fact that the change did occur may<br />
indicate that the transmissivity <strong>of</strong> the Culebra near P-<br />
18 is not constant even over the small volume<br />
stressed by the slug test.<br />
0.2<br />
0.1<br />
lo = 310103200<br />
[I DATA<br />
- TYPE CURVE<br />
\\<br />
V."<br />
107 100 103 102 103 IO'<br />
ELAPSED TIME, hours<br />
Figure 5-71, P-l8/Culebra Slug-Test Plot<br />
99


