

Beauheim 1987 - Waste Isolation Pilot Plant - U.S. Department of ...
Beauheim 1987 - Waste Isolation Pilot Plant - U.S. Department of ...
Beauheim 1987 - Waste Isolation Pilot Plant - U.S. Department of ...

You also want an ePaper? Increase the reach of your titles
YUMPU automatically turns print PDFs into web optimized ePapers that Google loves.
A positive value <strong>of</strong> s indicates wellbore damage, or a wellbore with a lower permeability than the formation as a<br />
whole as a result <strong>of</strong> drilling effects. Conversely, a negative value <strong>of</strong> s indicates a wellbore with enhanced<br />
permeability, usually caused by one or more fractures intersecting the wellbore.<br />
The type curves begin with an initial segment having a unit slope, corresponding to early-time dominance <strong>of</strong><br />
the pressure response by wellbore storage and skin effects. The duration <strong>of</strong> this unit slope segment is<br />
proportional to the amount <strong>of</strong> wellbore storage and skin that are present. At late time, the curves flatten as<br />
infinite-acting radial flow dominates.<br />
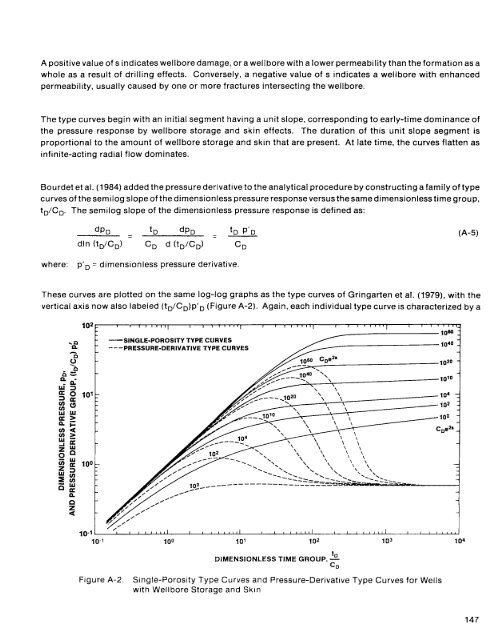
Bourdet et al. (1 984) added the pressure derivative to the analytical procedure by constructing a family <strong>of</strong> type<br />
curves <strong>of</strong> the semilog slope <strong>of</strong> thedimensionless pressure responseversus thesame dimensionless time group,<br />
tD/CD. The semilog slope <strong>of</strong> the dimensionless pressure response is defined as:<br />
(A-5)<br />
where: pfD = dimensionless pressure derivative<br />
These curves are plotted on the same log-log graphs as the type curves <strong>of</strong> Gringarten et al. (1979), with the<br />
vertical axis now also labeled (tD/CD)p'D (Figure A-2). Again, each individual type curve is characterized by a<br />
-n<br />
P<br />
n<br />
Y<br />
-<br />
6 s n<br />
-<br />
nL<br />
w3<br />
5 g lo',<br />
$0<br />
w w<br />
Z E<br />
cna<br />
102 - 1 I Ill,, I I 1 1 1 1 1 1 I I l 1 1 l I 1 I 1 1 1 1<br />
- - SINGLE-POROSITY TYPE CURVES<br />
--- PRESSURE-DERIVATIVE TYPE CURVES<br />
h<br />
- 3<br />
K - -<br />
n.<br />
n<br />
2<br />
a<br />
-<br />
-<br />
- -<br />
-<br />
-<br />
3<br />
10-1<br />
I 1 1 1 I l 1 1 l I L 1 L L , , , I I 1 I I , #Ill I I I O 1 1 1 1 1 I I, I , ,<br />
IO-' I00 10' 102 103 104<br />
Figure A-2.<br />
DIMENSIONLESS TIME GROUP, 1,<br />
CD<br />
Single-Porosity Type Curves and Pressure-Derivative Type Curves for Wells<br />
with Wellbore Storage and Skin<br />
147


