Publishing in the Knowledge Economy - DTI Home Page
Publishing in the Knowledge Economy - DTI Home Page
Publishing in the Knowledge Economy - DTI Home Page

You also want an ePaper? Increase the reach of your titles
YUMPU automatically turns print PDFs into web optimized ePapers that Google loves.
The <strong>in</strong>dustry today<br />
<strong>Publish<strong>in</strong>g</strong> <strong>in</strong> <strong>the</strong> knowledge economy<br />
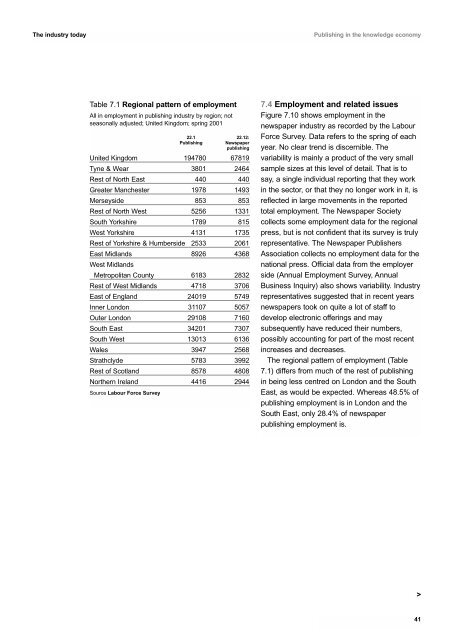
Table 7.1 Regional pattern of employment<br />
All <strong>in</strong> employment <strong>in</strong> publish<strong>in</strong>g <strong>in</strong>dustry by region; not<br />
seasonally adjusted; United K<strong>in</strong>gdom; spr<strong>in</strong>g 2001<br />
22.1 22.12:<br />
<strong>Publish<strong>in</strong>g</strong><br />
Newspaper<br />
publish<strong>in</strong>g<br />
United K<strong>in</strong>gdom 194780 67819<br />
Tyne & Wear 3801 2464<br />
Rest of North East 440 440<br />
Greater Manchester 1978 1493<br />
Merseyside 853 853<br />
Rest of North West 5256 1331<br />
South Yorkshire 1789 815<br />
West Yorkshire 4131 1735<br />
Rest of Yorkshire & Humberside 2533 2061<br />
East Midlands 8926 4368<br />
West Midlands<br />
Metropolitan County 6183 2832<br />
Rest of West Midlands 4718 3706<br />
East of England 24019 5749<br />
Inner London 31107 5057<br />
Outer London 29108 7160<br />
South East 34201 7307<br />
South West 13013 6136<br />
Wales 3947 2568<br />
Strathclyde 5783 3992<br />
Rest of Scotland 8578 4808<br />
Nor<strong>the</strong>rn Ireland 4416 2944<br />
Source Labour Force Survey<br />
7.4 Employment and related issues<br />
Figure 7.10 shows employment <strong>in</strong> <strong>the</strong><br />
newspaper <strong>in</strong>dustry as recorded by <strong>the</strong> Labour<br />
Force Survey. Data refers to <strong>the</strong> spr<strong>in</strong>g of each<br />
year. No clear trend is discernible. The<br />
variability is ma<strong>in</strong>ly a product of <strong>the</strong> very small<br />
sample sizes at this level of detail. That is to<br />
say, a s<strong>in</strong>gle <strong>in</strong>dividual report<strong>in</strong>g that <strong>the</strong>y work<br />
<strong>in</strong> <strong>the</strong> sector, or that <strong>the</strong>y no longer work <strong>in</strong> it, is<br />
reflected <strong>in</strong> large movements <strong>in</strong> <strong>the</strong> reported<br />
total employment. The Newspaper Society<br />
collects some employment data for <strong>the</strong> regional<br />
press, but is not confident that its survey is truly<br />
representative. The Newspaper Publishers<br />
Association collects no employment data for <strong>the</strong><br />
national press. Official data from <strong>the</strong> employer<br />
side (Annual Employment Survey, Annual<br />
Bus<strong>in</strong>ess Inquiry) also shows variability. Industry<br />
representatives suggested that <strong>in</strong> recent years<br />
newspapers took on quite a lot of staff to<br />
develop electronic offer<strong>in</strong>gs and may<br />
subsequently have reduced <strong>the</strong>ir numbers,<br />
possibly account<strong>in</strong>g for part of <strong>the</strong> most recent<br />
<strong>in</strong>creases and decreases.<br />
The regional pattern of employment (Table<br />
7.1) differs from much of <strong>the</strong> rest of publish<strong>in</strong>g<br />
<strong>in</strong> be<strong>in</strong>g less centred on London and <strong>the</strong> South<br />
East, as would be expected. Whereas 48.5% of<br />
publish<strong>in</strong>g employment is <strong>in</strong> London and <strong>the</strong><br />
South East, only 28.4% of newspaper<br />
publish<strong>in</strong>g employment is.<br />
><br />
41