

Florida Seaport System Plan - SeaCIP
Florida Seaport System Plan - SeaCIP
Florida Seaport System Plan - SeaCIP

You also want an ePaper? Increase the reach of your titles
YUMPU automatically turns print PDFs into web optimized ePapers that Google loves.
<strong>Florida</strong> <strong>Seaport</strong> <strong>System</strong> <strong>Plan</strong><br />
because so much can change in a period of 30 years, these forecasts are used as<br />
order of magnitude estimates of what the future could look like over the next 25<br />
years. Understanding potential cargo and passenger volumes is a critical factor<br />
driving major investment decisions, like dredging to 50-feet or constructing<br />
major Interstate connections.<br />
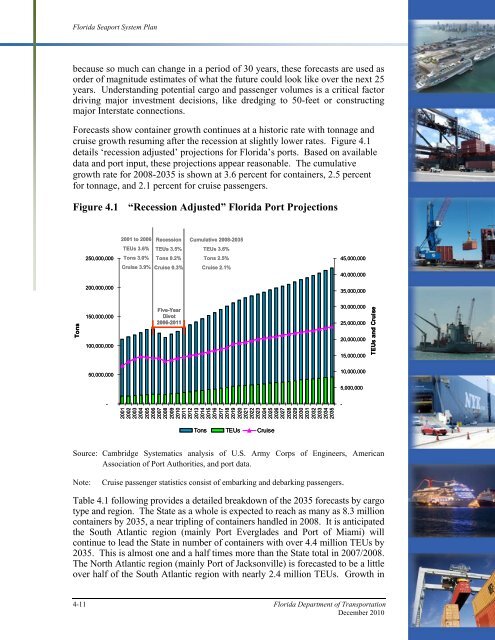
Forecasts show container growth continues at a historic rate with tonnage and<br />
cruise growth resuming after the recession at slightly lower rates. Figure 4.1<br />
details ‘recession adjusted’ projections for <strong>Florida</strong>’s ports. Based on available<br />
data and port input, these projections appear reasonable. The cumulative<br />
growth rate for 2008-2035 is shown at 3.6 percent for containers, 2.5 percent<br />
for tonnage, and 2.1 percent for cruise passengers.<br />
Figure 4.1 “Recession Adjusted” <strong>Florida</strong> Port Projections<br />
2001 to 2006<br />
Recession<br />
Cumulative 2008-2035<br />
TEUs 3.6%<br />
TEUs 3.5%<br />
TEUs 3.6%<br />
250,000,000<br />
Tons 3.0%<br />
Tons 0.2%<br />
Tons 2.5%<br />
45,000,000<br />
Cruise 3.9%<br />
Cruise 0.3%<br />
Cruise 2.1%<br />
40,000,000<br />
200,000,000<br />
35,000,000<br />
150,000,000<br />
100,000,000<br />
50,000,000<br />
-<br />
2001<br />
2002<br />
2003<br />
2004<br />
2005<br />
2006<br />
2007<br />
2008<br />
2009<br />
2010<br />
2011<br />
2012<br />
2013<br />
2014<br />
2015<br />
2016<br />
2017<br />
2018<br />
2019<br />
2020<br />
2021<br />
2022<br />
2023<br />
2024<br />
2025<br />
2026<br />
2027<br />
2028<br />
2029<br />
2030<br />
2031<br />
2032<br />
2033<br />
2034<br />
2035<br />
Tons<br />
Five-Year<br />
Divot<br />
2006-2011<br />
30,000,000<br />
25,000,000<br />
20,000,000<br />
15,000,000<br />
TEUs and Cruise<br />
10,000,000<br />
5,000,000<br />
-<br />
Tons TEUs Cruise<br />
Source: Cambridge <strong>System</strong>atics analysis of U.S. Army Corps of Engineers, American<br />
Association of Port Authorities, and port data.<br />
Note:<br />
Cruise passenger statistics consist of embarking and debarking passengers.<br />
Table 4.1 following provides a detailed breakdown of the 2035 forecasts by cargo<br />
type and region. The State as a whole is expected to reach as many as 8.3 million<br />
containers by 2035, a near tripling of containers handled in 2008. It is anticipated<br />
the South Atlantic region (mainly Port Everglades and Port of Miami) will<br />
continue to lead the State in number of containers with over 4.4 million TEUs by<br />
2035. This is almost one and a half times more than the State total in 2007/2008.<br />
The North Atlantic region (mainly Port of Jacksonville) is forecasted to be a little<br />
over half of the South Atlantic region with nearly 2.4 million TEUs. Growth in<br />
4-11 <strong>Florida</strong> Department of Transportation<br />
December 2010


