<strong>Florida</strong> <strong>Seaport</strong> <strong>System</strong> <strong>Plan</strong> Table 5.8 Summary of Current FDOT <strong>Seaport</strong> Work Program for All Funding Types Port 2011 2012 2013 2014 2015 2016 Total 6 Yrs Port Manatee $6,210,660 $4,631,965 $2,076,703 $3,539,286 $0 $0 $23,714,229 Port of Fernandina $150,000 $200,000 $0 $0 $0 $0 $350,000 Port of Jacksonville $1,900,000 $12,687,500 $10,000,000 $0 $10,000,000 $0 $34,587,500 Port of Panama City $1,175,000 $1,800,000 $500,000 $0 $0 $0 $3,475,000 Port of Pensacola $ 75,000 $1,500,000 $0 $0 $0 $0 $ 1,575,000 Port of port St. Joe $0 $0 $0 $0 $5,382 $0 $5,382 Port Everglades $ 1,900,000 $19,811,665 $25,246,463 $3,000,000 $4,718,000 $0 $54,676,128 Port of Palm Beach $1,236,000 $3,684,467 $3,392,500 $4,692,500 $2,001,000 $0 $15,006,467 Port of Ft. Pierce $ 0 $0 $1,300,000 $0 $0 $0 $1,300,000 Port Canaveral $9,105,166 $6,333,000 $0 $0 $9,750,000 $0 $25,188,166 Port of Miami $3,293,685 $3,639,217 $2,287,419 $18,165,637 $0 $0 $27,385,958 Port of Tampa $6,235,223 $17,891,069 $2,048,466 $1,896,175 $11,895,941 $1,318,598 $41,285,472 Port of St. Pete $ 819,839 $363,793 $0 $0 $0 $0 $1,183,632 FSTED 311 Funding a $0 $0 $15,000000 $15,000,000 $15,000,000 $15,000,000 $60,000,000 Data and <strong>Plan</strong>ning $ 630,050 $678,197 $299,999 $300,000 $300,000 $300,000 $2,508,246 Total <strong>Seaport</strong> and Intermodal Funding $32,730,623 $73,220,873 $62,151,550 $ 46,593,598 $60,400,933 $17,143,603 $292,241,180 Bond Debt Repayments $25,000,000 $25,000,000 $25,000,000 $25,000,000 $25,000,000 $25,000,000 $150,000,000 Grand Total of <strong>Seaport</strong> Investments $57,730,623 $98,220,873 $87,151,550 $71,593,598 $85,400,933 $42,143,603 $442,241,180 a FSTED funding not yet allocated to specific ports for FY 13- FY 16. Source: FDOT, December 2010. 5-14 <strong>Florida</strong> Department of Transportation December 2010
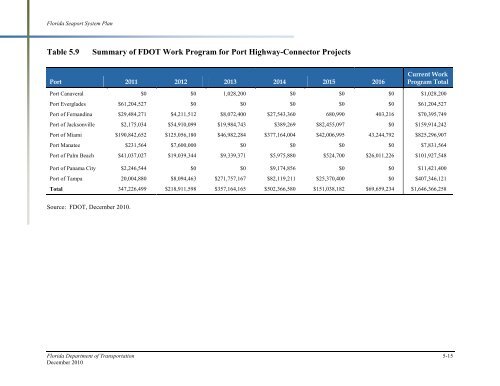
<strong>Florida</strong> <strong>Seaport</strong> <strong>System</strong> <strong>Plan</strong> Table 5.9 Summary of FDOT Work Program for Port Highway-Connector Projects Port 2011 2012 2013 2014 2015 2016 Current Work Program Total Port Canaveral $0 $0 1,028,200 $0 $0 $0 $1,028,200 Port Everglades $61,204,527 $0 $0 $0 $0 $0 $61,204,527 Port of Fernandina $29,484,271 $4,211,512 $8,072,400 $27,543,360 680,990 403,216 $70,395,749 Port of Jacksonville $2,175,034 $54,910,099 $19,984,743 $389,269 $82,455,097 $0 $159,914,242 Port of Miami $190,842,652 $125,056,180 $46,982,284 $377,164,004 $42,006,995 43,244,792 $825,296,907 Port Manatee $231,564 $7,600,000 $0 $0 $0 $0 $7,831,564 Port of Palm Beach $41,037,027 $19,039,344 $9,339,371 $5,975,880 $524,700 $26,011,226 $101,927,548 Port of Panama City $2,246,544 $0 $0 $9,174,856 $0 $0 $11,421,400 Port of Tampa 20,004,880 $8,094,463 $271,757,167 $82,119,211 $25,370,400 $0 $407,346,121 Total 347,226,499 $218,911,598 $357,164,165 $502,366,580 $151,038,182 $69,659,234 $1,646,366,258 Source: FDOT, December 2010. <strong>Florida</strong> Department of Transportation 5-15 December 2010