<strong>Florida</strong> <strong>Seaport</strong> <strong>System</strong> <strong>Plan</strong> information should be used and interpreted. The ports have different methodologies for reporting their short-term capital needs. The information used as part of the <strong>Plan</strong> represents a good faith effort to ascertain the most current data available. The needs should be reviewed and updated annually to maintain as accurate a list as possible. <strong>SeaCIP</strong> 4.0 1 will become an active data management tool to ensure up-to-date project information is available. Summary of Five-Year Cumulative On-Port Needs <strong>Florida</strong>’s seaports update their CIPs regularly to identify and assess future improvements necessary to meet potential market demands. Despite the current economic conditions, the five-year CIPs for <strong>Florida</strong>’s seaports have increased. The projected five-year program for fiscal years 2009-2010 through 2013-2014 is over $2.73 billion. Table 5.1 presents the seaports’ cumulative five-year CIP for fiscal years 2009/2010 through 2013/2014. The four largest ports (Everglades, Jacksonville, Miami, and Tampa) represent over 81 percent of the total capital improvement program. The Port of Jacksonville stands out from its peers given the large amount of identified capital needs in fiscal year 2013/2014. Table 5.1 Statewide Capital Improvement Program FY 09/10 – 13/14 <strong>Seaport</strong>s FY 09-10 FY 10-11 FY 11-12 FY 12-13 FY 13-14 Total CIP Canaveral $65,766,000 $40,788,000 $69,075,000 $31,618,000 $25,474,000 $232,721,000 Everglades $35,737,000 $54,590,000 $36,586,000 $97,146,000 $113,634,000 $337,693,000 Fernandina $1,000,000 $1,805,000 $4,700,000 $5,910,000 $3,360,000 $16,775,000 Fort Pierce $3,699,251 $3,500,000 $0 $0 $0 $7,199,251 Jacksonville $66,818,869 $146,896,958 $193,514,275 $18,709,275 $492,000,000 $917,939,377 Key West $0 $0 $2,600,000 $1,600,000 $0 $4,200,000 Manatee $32,150,000 $18,650,000 $28,400,000 $26,400,000 $18,400,000 $124,000,000 Miami $42,599,000 $158,143,000 $86,068,000 $151,950,000 $143,775,000 $582,535,000 Palm Beach $1,150,000 $4,484,000 $6,500,000 $4,700,000 $19,641,000 $36,475,000 Panama City $6,375,000 $12,425,000 $4,850,000 $4,300,000 $6,200,000 $34,150,000 Pensacola $1,305,000 $3,115,000 $3,075,000 $6,400,000 $0 $13,895,000 Port St. Joe $1,322,000 $1,482,000 $11,280,000 $27,960,000 $0 $42,044,000 St. Petersburg $0 $1,664,600 $1,015,000 $1,015,000 $0 $3,694,600 Tampa $76,535,000 $76,911,670 $69,995,000 $77,240,000 $77,170,000 $377,851,670 Total $334,457,120 $524,455,228 $517,658,275 $454,948,275 $899,654,000 $2,731,172,898 Source: <strong>Seaport</strong>-specific CIPs were collected and reviewed; seaports provided updates as of October 2010. Figure 5.1 illustrates the on-port seaport capital improvement program by year. Over 12 percent of the capital improvement program is allocated for fiscal year 2009/2010. Nineteen percent is allocated for fiscal years 2010/2011 and 1 <strong>SeaCIP</strong> 4.0 is the next generation of the application management program for <strong>Florida</strong> <strong>Seaport</strong> Transportation and Economic Development Council (FSTED) projects. This version has been expanded to capture all state funded seaport projects and operate a needs database in addition to the application management function. 5-2 <strong>Florida</strong> Department of Transportation December 2010
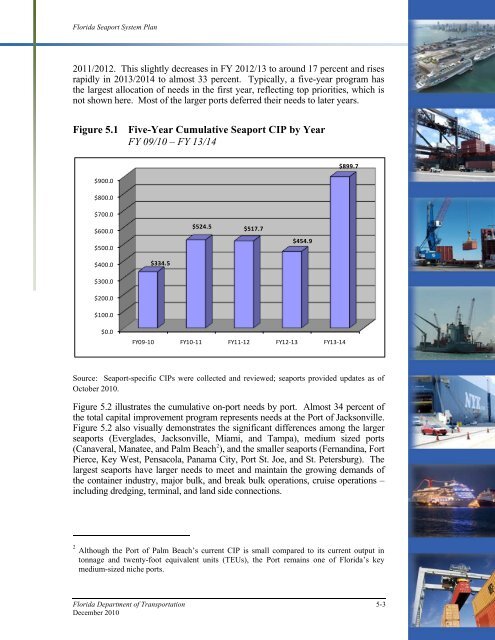
<strong>Florida</strong> <strong>Seaport</strong> <strong>System</strong> <strong>Plan</strong> 2011/2012. This slightly decreases in FY 2012/13 to around 17 percent and rises rapidly in 2013/2014 to almost 33 percent. Typically, a five-year program has the largest allocation of needs in the first year, reflecting top priorities, which is not shown here. Most of the larger ports deferred their needs to later years. Figure 5.1 Five-Year Cumulative <strong>Seaport</strong> CIP by Year FY 09/10 – FY 13/14 $899.7 $900.0 $800.0 $700.0 $600.0 $500.0 $524.5 $517.7 $454.9 $400.0 $334.5 $300.0 $200.0 $100.0 $0.0 FY09-10 FY10-11 FY11-12 FY12-13 FY13-14 Source: <strong>Seaport</strong>-specific CIPs were collected and reviewed; seaports provided updates as of October 2010. Figure 5.2 illustrates the cumulative on-port needs by port. Almost 34 percent of the total capital improvement program represents needs at the Port of Jacksonville. Figure 5.2 also visually demonstrates the significant differences among the larger seaports (Everglades, Jacksonville, Miami, and Tampa), medium sized ports (Canaveral, Manatee, and Palm Beach 2 ), and the smaller seaports (Fernandina, Fort Pierce, Key West, Pensacola, Panama City, Port St. Joe, and St. Petersburg). The largest seaports have larger needs to meet and maintain the growing demands of the container industry, major bulk, and break bulk operations, cruise operations – including dredging, terminal, and land side connections. 2 Although the Port of Palm Beach’s current CIP is small compared to its current output in tonnage and twenty-foot equivalent units (TEUs), the Port remains one of <strong>Florida</strong>’s key medium-sized niche ports. <strong>Florida</strong> Department of Transportation 5-3 December 2010