Florida Seaport System Plan - SeaCIP
Florida Seaport System Plan - SeaCIP
Florida Seaport System Plan - SeaCIP
Create successful ePaper yourself
Turn your PDF publications into a flip-book with our unique Google optimized e-Paper software.
<strong>Florida</strong> <strong>Seaport</strong> <strong>System</strong> <strong>Plan</strong><br />
How <strong>Florida</strong> and its ports deal with constraints and opportunities is, of course, a<br />
critical policy question. To better address this question, the <strong>Florida</strong> Chamber<br />
Foundation, FDOT, the <strong>Florida</strong> Ports Council (FPC), and other stakeholders<br />
partnered in a comprehensive Trade and Logistics Study of all transportation<br />
modes serving <strong>Florida</strong>. As part of that study, a set of detailed international<br />
cargo forecasts was developed.<br />
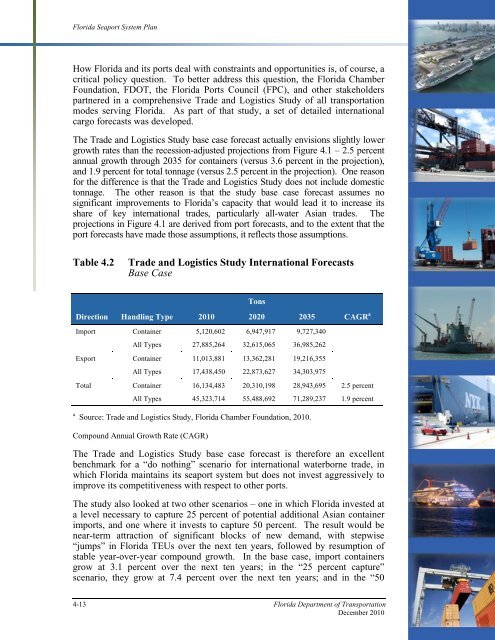
The Trade and Logistics Study base case forecast actually envisions slightly lower<br />
growth rates than the recession-adjusted projections from Figure 4.1 – 2.5 percent<br />
annual growth through 2035 for containers (versus 3.6 percent in the projection),<br />
and 1.9 percent for total tonnage (versus 2.5 percent in the projection). One reason<br />
for the difference is that the Trade and Logistics Study does not include domestic<br />
tonnage. The other reason is that the study base case forecast assumes no<br />
significant improvements to <strong>Florida</strong>’s capacity that would lead it to increase its<br />
share of key international trades, particularly all-water Asian trades. The<br />
projections in Figure 4.1 are derived from port forecasts, and to the extent that the<br />
port forecasts have made those assumptions, it reflects those assumptions.<br />
Table 4.2<br />
Trade and Logistics Study International Forecasts<br />
Base Case<br />
Direction Handling Type 2010<br />
Tons<br />
2020 2035 CAGR a<br />
Import Container 5,120,602 6,947,917 9,727,340<br />
All Types 27,885,264 32,615,065 36,985,262<br />
Export Container 11,013,881 13,362,281 19,216,355<br />
All Types 17,438,450 22,873,627 34,303,975<br />
Total Container 16,134,483 20,310,198 28,943,695 2.5 percent<br />
All Types 45,323,714 55,488,692 71,289,237 1.9 percent<br />
a Source: Trade and Logistics Study, <strong>Florida</strong> Chamber Foundation, 2010.<br />
Compound Annual Growth Rate (CAGR)<br />
The Trade and Logistics Study base case forecast is therefore an excellent<br />
benchmark for a “do nothing” scenario for international waterborne trade, in<br />
which <strong>Florida</strong> maintains its seaport system but does not invest aggressively to<br />
improve its competitiveness with respect to other ports.<br />
The study also looked at two other scenarios – one in which <strong>Florida</strong> invested at<br />
a level necessary to capture 25 percent of potential additional Asian container<br />
imports, and one where it invests to capture 50 percent. The result would be<br />
near-term attraction of significant blocks of new demand, with stepwise<br />
“jumps” in <strong>Florida</strong> TEUs over the next ten years, followed by resumption of<br />
stable year-over-year compound growth. In the base case, import containers<br />
grow at 3.1 percent over the next ten years; in the “25 percent capture”<br />
scenario, they grow at 7.4 percent over the next ten years; and in the “50<br />
4-13 <strong>Florida</strong> Department of Transportation<br />
December 2010


