Sri Lanka Human Development Report 2012.pdf
Sri Lanka Human Development Report 2012.pdf
Sri Lanka Human Development Report 2012.pdf
You also want an ePaper? Increase the reach of your titles
YUMPU automatically turns print PDFs into web optimized ePapers that Google loves.
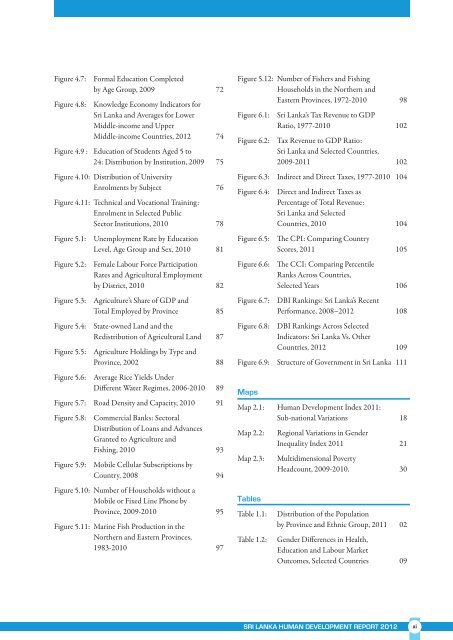
Figure 4.7:<br />
Figure 4.8:<br />
Formal Education Completed<br />
by Age Group, 2009 72<br />
Knowledge Economy Indicators for<br />
<strong>Sri</strong> <strong>Lanka</strong> and Averages for Lower<br />
Middle-income and Upper<br />
Middle-income Countries, 2012 74<br />
Figure 4.9 : Education of Students Aged 5 to<br />
24: Distribution by Institution, 2009 75<br />
Figure 4.10: Distribution of University<br />
Enrolments by Subject 76<br />
Figure 4.11: Technical and Vocational Training:<br />
Enrolment in Selected Public<br />
Sector Institutions, 2010 78<br />
Figure 5.1:<br />
Figure 5.2:<br />
Figure 5.3:<br />
Figure 5.4:<br />
Figure 5.5:<br />
Figure 5.6:<br />
Unemployment Rate by Education<br />
Level, Age Group and Sex, 2010 81<br />
Female Labour Force Participation<br />
Rates and Agricultural Employment<br />
by District, 2010 82<br />
Agriculture’s Share of GDP and<br />
Total Employed by Province 85<br />
State-owned Land and the<br />
Redistribution of Agricultural Land 87<br />
Agriculture Holdings by Type and<br />
Province, 2002 88<br />
Average Rice Yields Under<br />
Different Water Regimes, 2006-2010 89<br />
Figure 5.7: Road Density and Capacity, 2010 91<br />
Figure 5.8:<br />
Figure 5.9:<br />
Commercial Banks: Sectoral<br />
Distribution of Loans and Advances<br />
Granted to Agriculture and<br />
Fishing, 2010 93<br />
Mobile Cellular Subscriptions by<br />
Country, 2008 94<br />
Figure 5.10: Number of Households without a<br />
Mobile or Fixed Line Phone by<br />
Province, 2009-2010 95<br />
Figure 5.11: Marine Fish Production in the<br />
Northern and Eastern Provinces,<br />
1983-2010 97<br />
Figure 5.12: Number of Fishers and Fishing<br />
Households in the Northern and<br />
Eastern Provinces, 1972-2010 98<br />
Figure 6.1:<br />
Figure 6.2:<br />
<strong>Sri</strong> <strong>Lanka</strong>’s Tax Revenue to GDP<br />
Ratio, 1977-2010 102<br />
Tax Revenue to GDP Ratio:<br />
<strong>Sri</strong> <strong>Lanka</strong> and Selected Countries,<br />
2009-2011 102<br />
Figure 6.3: Indirect and Direct Taxes, 1977-2010 104<br />
Figure 6.4:<br />
Figure 6.5:<br />
Figure 6.6:<br />
Figure 6.7:<br />
Figure 6.8:<br />
Direct and Indirect Taxes as<br />
Percentage of Total Revenue:<br />
<strong>Sri</strong> <strong>Lanka</strong> and Selected<br />
Countries, 2010 104<br />
The CPI: Comparing Country<br />
Scores, 2011 105<br />
The CCI: Comparing Percentile<br />
Ranks Across Countries,<br />
Selected Years 106<br />
DBI Rankings: <strong>Sri</strong> <strong>Lanka</strong>’s Recent<br />
Performance, 2008–2012 108<br />
DBI Rankings Across Selected<br />
Indicators: <strong>Sri</strong> <strong>Lanka</strong> Vs. Other<br />
Countries, 2012 109<br />
Figure 6.9: Structure of Government in <strong>Sri</strong> <strong>Lanka</strong> 111<br />
Maps<br />
Map 2.1: <strong>Human</strong> <strong>Development</strong> Index 2011:<br />
Sub-national Variations 18<br />
Map 2.2:<br />
Map 2.3:<br />
Tables<br />
Table 1.1:<br />
Table 1.2:<br />
Regional Variations in Gender<br />
Inequality Index 2011 21<br />
Multidimensional Poverty<br />
Headcount, 2009-2010. 30<br />
Distribution of the Population<br />
by Province and Ethnic Group, 2011 02<br />
Gender Differences in Health,<br />
Education and Labour Market<br />
Outcomes, Selected Countries 09<br />
sri lanka <strong>Human</strong> <strong>Development</strong> report 2012<br />
xi


