Intel® Trace Analyzer User's Reference Guide
Intel® Trace Analyzer User's Reference Guide
Intel® Trace Analyzer User's Reference Guide

Create successful ePaper yourself
Turn your PDF publications into a flip-book with our unique Google optimized e-Paper software.
Intel® <strong>Trace</strong> <strong>Analyzer</strong> <strong>User's</strong> <strong>Reference</strong> <strong>Guide</strong><br />
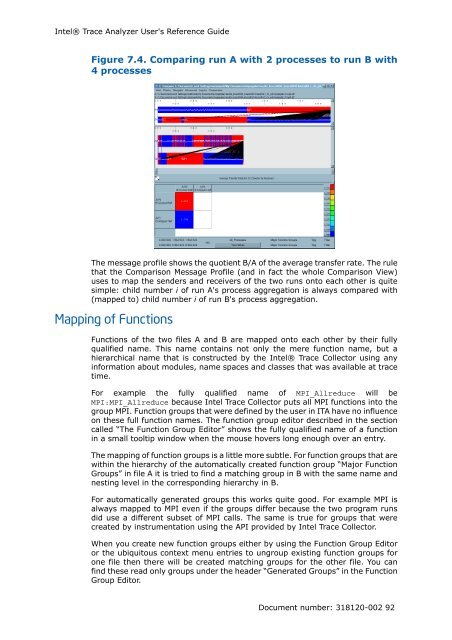
Figure 7.4. Comparing run A with 2 processes to run B with<br />
4 processes<br />
The message profile shows the quotient B/A of the average transfer rate. The rule<br />
that the Comparison Message Profile (and in fact the whole Comparison View)<br />
uses to map the senders and receivers of the two runs onto each other is quite<br />
simple: child number i of run A's process aggregation is always compared with<br />
(mapped to) child number i of run B's process aggregation.<br />
Mapping of Functions<br />
Functions of the two files A and B are mapped onto each other by their fully<br />
qualified name. This name contains not only the mere function name, but a<br />
hierarchical name that is constructed by the Intel® <strong>Trace</strong> Collector using any<br />
information about modules, name spaces and classes that was available at trace<br />
time.<br />
For example the fully qualified name of MPI_Allreduce will be<br />
MPI:MPI_Allreduce because Intel <strong>Trace</strong> Collector puts all MPI functions into the<br />
group MPI. Function groups that were defined by the user in ITA have no influence<br />
on these full function names. The function group editor described in the section<br />
called “The Function Group Editor” shows the fully qualified name of a function<br />
in a small tooltip window when the mouse hovers long enough over an entry.<br />
The mapping of function groups is a little more subtle. For function groups that are<br />
within the hierarchy of the automatically created function group “Major Function<br />
Groups” in file A it is tried to find a matching group in B with the same name and<br />
nesting level in the corresponding hierarchy in B.<br />
For automatically generated groups this works quite good. For example MPI is<br />
always mapped to MPI even if the groups differ because the two program runs<br />
did use a different subset of MPI calls. The same is true for groups that were<br />
created by instrumentation using the API provided by Intel <strong>Trace</strong> Collector.<br />
When you create new function groups either by using the Function Group Editor<br />
or the ubiquitous context menu entries to ungroup existing function groups for<br />
one file then there will be created matching groups for the other file. You can<br />
find these read only groups under the header “Generated Groups” in the Function<br />
Group Editor.<br />
Document number: 318120-002 92