Intel® Trace Analyzer User's Reference Guide
Intel® Trace Analyzer User's Reference Guide
Intel® Trace Analyzer User's Reference Guide
Create successful ePaper yourself
Turn your PDF publications into a flip-book with our unique Google optimized e-Paper software.
Intel® <strong>Trace</strong> <strong>Analyzer</strong> <strong>User's</strong> <strong>Reference</strong> <strong>Guide</strong><br />
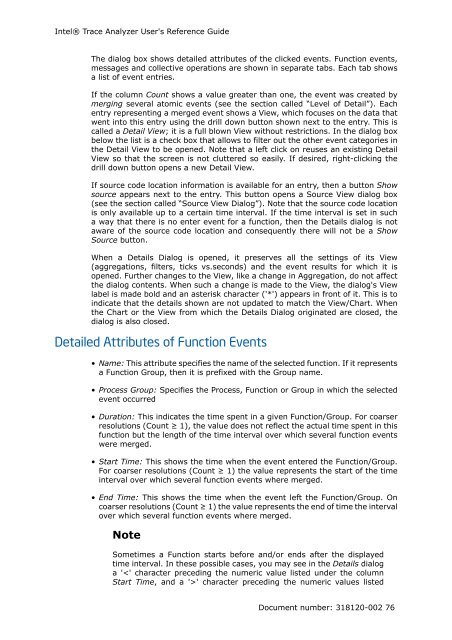
The dialog box shows detailed attributes of the clicked events. Function events,<br />
messages and collective operations are shown in separate tabs. Each tab shows<br />
a list of event entries.<br />
If the column Count shows a value greater than one, the event was created by<br />
merging several atomic events (see the section called “Level of Detail”). Each<br />
entry representing a merged event shows a View, which focuses on the data that<br />
went into this entry using the drill down button shown next to the entry. This is<br />
called a Detail View; it is a full blown View without restrictions. In the dialog box<br />
below the list is a check box that allows to filter out the other event categories in<br />
the Detail View to be opened. Note that a left click on reuses an existing Detail<br />
View so that the screen is not cluttered so easily. If desired, right-clicking the<br />
drill down button opens a new Detail View.<br />
If source code location information is available for an entry, then a button Show<br />
source appears next to the entry. This button opens a Source View dialog box<br />
(see the section called “Source View Dialog”). Note that the source code location<br />
is only available up to a certain time interval. If the time interval is set in such<br />
a way that there is no enter event for a function, then the Details dialog is not<br />
aware of the source code location and consequently there will not be a Show<br />
Source button.<br />
When a Details Dialog is opened, it preserves all the settings of its View<br />
(aggregations, filters, ticks vs.seconds) and the event results for which it is<br />
opened. Further changes to the View, like a change in Aggregation, do not affect<br />
the dialog contents. When such a change is made to the View, the dialog's View<br />
label is made bold and an asterisk character ('*') appears in front of it. This is to<br />
indicate that the details shown are not updated to match the View/Chart. When<br />
the Chart or the View from which the Details Dialog originated are closed, the<br />
dialog is also closed.<br />
Detailed Attributes of Function Events<br />
• Name: This attribute specifies the name of the selected function. If it represents<br />
a Function Group, then it is prefixed with the Group name.<br />
• Process Group: Specifies the Process, Function or Group in which the selected<br />
event occurred<br />
• Duration: This indicates the time spent in a given Function/Group. For coarser<br />
resolutions (Count ≥ 1), the value does not reflect the actual time spent in this<br />
function but the length of the time interval over which several function events<br />
were merged.<br />
• Start Time: This shows the time when the event entered the Function/Group.<br />
For coarser resolutions (Count ≥ 1) the value represents the start of the time<br />
interval over which several function events where merged.<br />
• End Time: This shows the time when the event left the Function/Group. On<br />
coarser resolutions (Count ≥ 1) the value represents the end of time the interval<br />
over which several function events where merged.<br />
Note<br />
Sometimes a Function starts before and/or ends after the displayed<br />
time interval. In these possible cases, you may see in the Details dialog<br />
a '' character preceding the numeric values listed<br />
Document number: 318120-002 76


