Intel® Trace Analyzer User's Reference Guide
Intel® Trace Analyzer User's Reference Guide
Intel® Trace Analyzer User's Reference Guide

Create successful ePaper yourself
Turn your PDF publications into a flip-book with our unique Google optimized e-Paper software.
Intel® <strong>Trace</strong> <strong>Analyzer</strong> <strong>User's</strong> <strong>Reference</strong> <strong>Guide</strong><br />
The Display Group specifies which scales to show and whether an own legend<br />
needs to be displayed for the timeline. By default, the vertical scale and the<br />
legend are shown.<br />
Use the Vertical Scaling group to switch between the default Automatic Scaling<br />
and the Manual Scaling of the y-axis. To explicitly specify the maximum scale<br />
value, use Manual scaling. To visually compare two or more Charts in the same<br />
or distinct Views, specify the same maximum value for the charts.<br />
Context Menu<br />
The entry Context Menu → Events to show allows to choose the event type from<br />
Function Events, Messages and Collective Ops via a sub-menu.<br />
The entry Context Menu → Attribute to show → xxx allows to choose the particular<br />
attribute value of the event from Duration, Transfer Rate or Data Volume via a<br />
sub-menu. Note that not all attributes are available for all event types.<br />
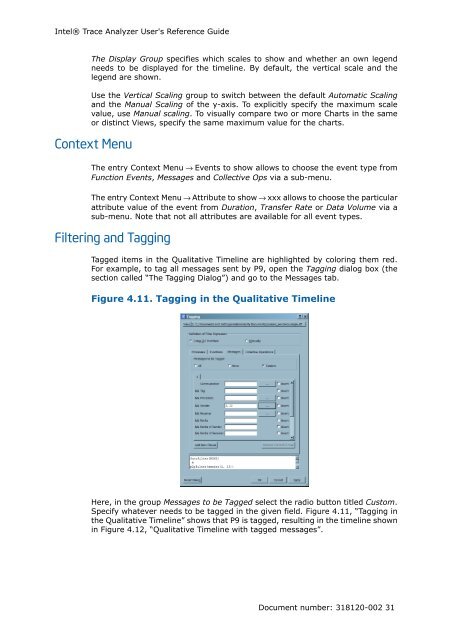
Filtering and Tagging<br />
Tagged items in the Qualitative Timeline are highlighted by coloring them red.<br />
For example, to tag all messages sent by P9, open the Tagging dialog box (the<br />
section called “The Tagging Dialog”) and go to the Messages tab.<br />
Figure 4.11. Tagging in the Qualitative Timeline<br />
Here, in the group Messages to be Tagged select the radio button titled Custom.<br />
Specify whatever needs to be tagged in the given field. Figure 4.11, “Tagging in<br />
the Qualitative Timeline” shows that P9 is tagged, resulting in the timeline shown<br />
in Figure 4.12, “Qualitative Timeline with tagged messages”.<br />
Document number: 318120-002 31