Intel® Trace Analyzer User's Reference Guide
Intel® Trace Analyzer User's Reference Guide
Intel® Trace Analyzer User's Reference Guide

You also want an ePaper? Increase the reach of your titles
YUMPU automatically turns print PDFs into web optimized ePapers that Google loves.
Intel® <strong>Trace</strong> <strong>Analyzer</strong> <strong>User's</strong> <strong>Reference</strong> <strong>Guide</strong><br />
Chapter 7. Comparison of two <strong>Trace</strong> Files<br />
The simplest way to compare two trace files or two time intervals from the same<br />
trace file is to open two Views and to look at them next to each other. While<br />
this provides a rough overview, a Comparison View allows to calculate the exact<br />
differences and speedups between two runs or between two ranges of the same<br />
run. To open a Comparison View for two files, open the files and choose View<br />
Menu → View → Compare in one of the Views.<br />
Choose the other View from the dialog that appears. Notice that the dialog<br />
provides the opportunity to open another file.<br />
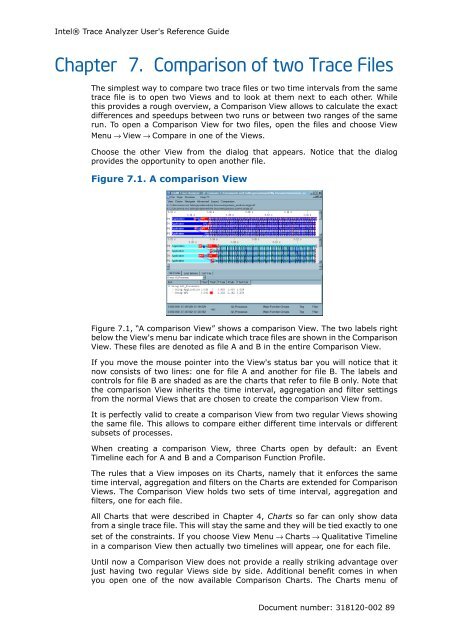
Figure 7.1. A comparison View<br />
Figure 7.1, “A comparison View” shows a comparison View. The two labels right<br />
below the View's menu bar indicate which trace files are shown in the Comparison<br />
View. These files are denoted as file A and B in the entire Comparison View.<br />
If you move the mouse pointer into the View's status bar you will notice that it<br />
now consists of two lines: one for file A and another for file B. The labels and<br />
controls for file B are shaded as are the charts that refer to file B only. Note that<br />
the comparison View inherits the time interval, aggregation and filter settings<br />
from the normal Views that are chosen to create the comparison View from.<br />
It is perfectly valid to create a comparison View from two regular Views showing<br />
the same file. This allows to compare either different time intervals or different<br />
subsets of processes.<br />
When creating a comparison View, three Charts open by default: an Event<br />
Timeline each for A and B and a Comparison Function Profile.<br />
The rules that a View imposes on its Charts, namely that it enforces the same<br />
time interval, aggregation and filters on the Charts are extended for Comparison<br />
Views. The Comparison View holds two sets of time interval, aggregation and<br />
filters, one for each file.<br />
All Charts that were described in Chapter 4, Charts so far can only show data<br />
from a single trace file. This will stay the same and they will be tied exactly to one<br />
set of the constraints. If you choose View Menu → Charts → Qualitative Timeline<br />
in a comparison View then actually two timelines will appear, one for each file.<br />
Until now a Comparison View does not provide a really striking advantage over<br />
just having two regular Views side by side. Additional benefit comes in when<br />
you open one of the now available Comparison Charts. The Charts menu of<br />
Document number: 318120-002 89