Intel® Trace Analyzer User's Reference Guide
Intel® Trace Analyzer User's Reference Guide
Intel® Trace Analyzer User's Reference Guide

Create successful ePaper yourself
Turn your PDF publications into a flip-book with our unique Google optimized e-Paper software.
Intel® <strong>Trace</strong> <strong>Analyzer</strong> <strong>User's</strong> <strong>Reference</strong> <strong>Guide</strong><br />
Chapter 1. Introduction<br />
The Intel® <strong>Trace</strong> <strong>Analyzer</strong> is a graphical tool that displays and analyzes event<br />
trace data generated by the Intel® <strong>Trace</strong> Collector. It helps in detecting<br />
performance problems, programming errors or in understanding the behavior<br />
of the application. This document describes the feature set of the Intel <strong>Trace</strong><br />
<strong>Analyzer</strong>.<br />
Notation and Terms<br />
• Menus and menu entries are printed as shown below:<br />
Main Menu → File → Exit<br />
This denotes the “Exit” entry in the “File” section of the Main Menu.<br />
• Shell commands are printed with a leading '$'. For example,<br />
$ ls<br />
denotes the UNIX command “ls”.<br />
• The following line is an example of how source code is presented:<br />
CALL MPI_FINALIZE()<br />
The term “process” in this documentation implicitly includes thread. As soon<br />
as the Intel <strong>Trace</strong> <strong>Analyzer</strong> loads a trace file that was generated running a<br />
multithreaded application, the GUI uses the term “thread” only if it is applicable.<br />
This is done to avoid confusing MPI application programmers who normally use<br />
the term “process” instead of “thread”.<br />
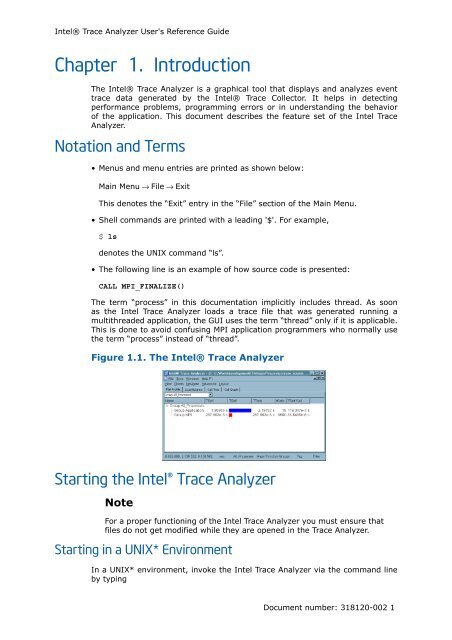
Figure 1.1. The Intel® <strong>Trace</strong> <strong>Analyzer</strong><br />
Starting the Intel® <strong>Trace</strong> <strong>Analyzer</strong><br />
Note<br />
For a proper functioning of the Intel <strong>Trace</strong> <strong>Analyzer</strong> you must ensure that<br />
files do not get modified while they are opened in the <strong>Trace</strong> <strong>Analyzer</strong>.<br />
Starting in a UNIX* Environment<br />
In a UNIX* environment, invoke the Intel <strong>Trace</strong> <strong>Analyzer</strong> via the command line<br />
by typing<br />
Document number: 318120-002 1