Intel® Trace Analyzer User's Reference Guide
Intel® Trace Analyzer User's Reference Guide
Intel® Trace Analyzer User's Reference Guide
You also want an ePaper? Increase the reach of your titles
YUMPU automatically turns print PDFs into web optimized ePapers that Google loves.
Intel® <strong>Trace</strong> <strong>Analyzer</strong> <strong>User's</strong> <strong>Reference</strong> <strong>Guide</strong><br />
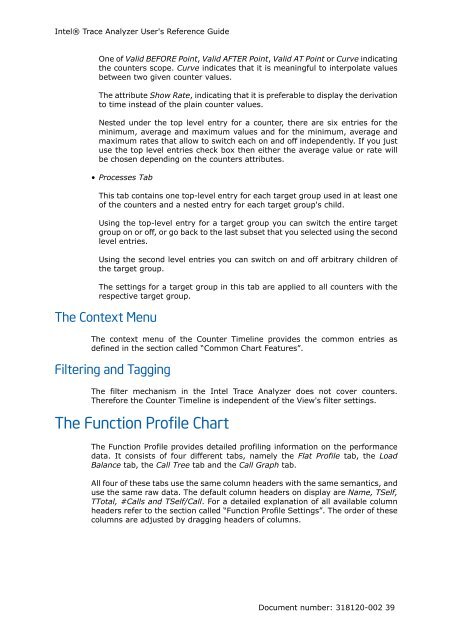
One of Valid BEFORE Point, Valid AFTER Point, Valid AT Point or Curve indicating<br />
the counters scope. Curve indicates that it is meaningful to interpolate values<br />
between two given counter values.<br />
The attribute Show Rate, indicating that it is preferable to display the derivation<br />
to time instead of the plain counter values.<br />
Nested under the top level entry for a counter, there are six entries for the<br />
minimum, average and maximum values and for the minimum, average and<br />
maximum rates that allow to switch each on and off independently. If you just<br />
use the top level entries check box then either the average value or rate will<br />
be chosen depending on the counters attributes.<br />
• Processes Tab<br />
This tab contains one top-level entry for each target group used in at least one<br />
of the counters and a nested entry for each target group's child.<br />
Using the top-level entry for a target group you can switch the entire target<br />
group on or off, or go back to the last subset that you selected using the second<br />
level entries.<br />
Using the second level entries you can switch on and off arbitrary children of<br />
the target group.<br />
The settings for a target group in this tab are applied to all counters with the<br />
respective target group.<br />
The Context Menu<br />
The context menu of the Counter Timeline provides the common entries as<br />
defined in the section called “Common Chart Features”.<br />
Filtering and Tagging<br />
The filter mechanism in the Intel <strong>Trace</strong> <strong>Analyzer</strong> does not cover counters.<br />
Therefore the Counter Timeline is independent of the View's filter settings.<br />
The Function Profile Chart<br />
The Function Profile provides detailed profiling information on the performance<br />
data. It consists of four different tabs, namely the Flat Profile tab, the Load<br />
Balance tab, the Call Tree tab and the Call Graph tab.<br />
All four of these tabs use the same column headers with the same semantics, and<br />
use the same raw data. The default column headers on display are Name, TSelf,<br />
TTotal, #Calls and TSelf/Call. For a detailed explanation of all available column<br />
headers refer to the section called “Function Profile Settings”. The order of these<br />
columns are adjusted by dragging headers of columns.<br />
Document number: 318120-002 39


