Intel® Trace Analyzer User's Reference Guide
Intel® Trace Analyzer User's Reference Guide
Intel® Trace Analyzer User's Reference Guide

You also want an ePaper? Increase the reach of your titles
YUMPU automatically turns print PDFs into web optimized ePapers that Google loves.
Intel® <strong>Trace</strong> <strong>Analyzer</strong> <strong>User's</strong> <strong>Reference</strong> <strong>Guide</strong><br />
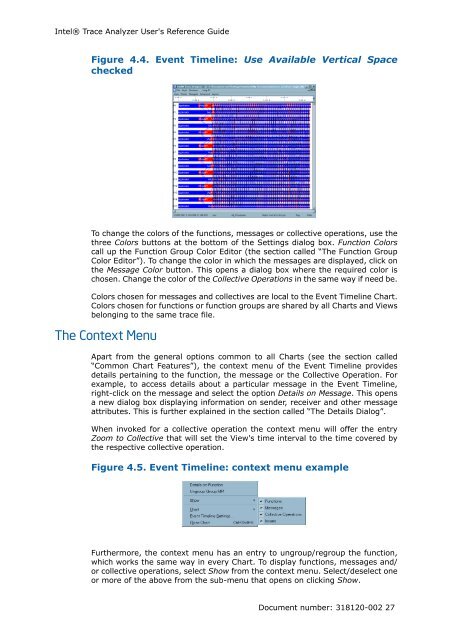
Figure 4.4. Event Timeline: Use Available Vertical Space<br />
checked<br />
To change the colors of the functions, messages or collective operations, use the<br />
three Colors buttons at the bottom of the Settings dialog box. Function Colors<br />
call up the Function Group Color Editor (the section called “The Function Group<br />
Color Editor”). To change the color in which the messages are displayed, click on<br />
the Message Color button. This opens a dialog box where the required color is<br />
chosen. Change the color of the Collective Operations in the same way if need be.<br />
Colors chosen for messages and collectives are local to the Event Timeline Chart.<br />
Colors chosen for functions or function groups are shared by all Charts and Views<br />
belonging to the same trace file.<br />
The Context Menu<br />
Apart from the general options common to all Charts (see the section called<br />
“Common Chart Features”), the context menu of the Event Timeline provides<br />
details pertaining to the function, the message or the Collective Operation. For<br />
example, to access details about a particular message in the Event Timeline,<br />
right-click on the message and select the option Details on Message. This opens<br />
a new dialog box displaying information on sender, receiver and other message<br />
attributes. This is further explained in the section called “The Details Dialog”.<br />
When invoked for a collective operation the context menu will offer the entry<br />
Zoom to Collective that will set the View's time interval to the time covered by<br />
the respective collective operation.<br />
Figure 4.5. Event Timeline: context menu example<br />
Furthermore, the context menu has an entry to ungroup/regroup the function,<br />
which works the same way in every Chart. To display functions, messages and/<br />
or collective operations, select Show from the context menu. Select/deselect one<br />
or more of the above from the sub-menu that opens on clicking Show.<br />
Document number: 318120-002 27