Intel® Trace Analyzer User's Reference Guide
Intel® Trace Analyzer User's Reference Guide
Intel® Trace Analyzer User's Reference Guide

Create successful ePaper yourself
Turn your PDF publications into a flip-book with our unique Google optimized e-Paper software.
Intel® <strong>Trace</strong> <strong>Analyzer</strong> <strong>User's</strong> <strong>Reference</strong> <strong>Guide</strong><br />
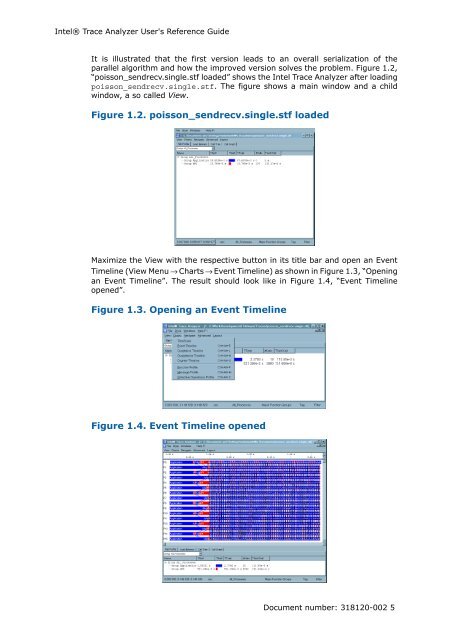
It is illustrated that the first version leads to an overall serialization of the<br />
parallel algorithm and how the improved version solves the problem. Figure 1.2,<br />
“poisson_sendrecv.single.stf loaded” shows the Intel <strong>Trace</strong> <strong>Analyzer</strong> after loading<br />
poisson_sendrecv.single.stf. The figure shows a main window and a child<br />
window, a so called View.<br />
Figure 1.2. poisson_sendrecv.single.stf loaded<br />
Maximize the View with the respective button in its title bar and open an Event<br />
Timeline (View Menu → Charts → Event Timeline) as shown in Figure 1.3, “Opening<br />
an Event Timeline”. The result should look like in Figure 1.4, “Event Timeline<br />
opened”.<br />
Figure 1.3. Opening an Event Timeline<br />
Figure 1.4. Event Timeline opened<br />
Document number: 318120-002 5