Intel® Trace Analyzer User's Reference Guide
Intel® Trace Analyzer User's Reference Guide
Intel® Trace Analyzer User's Reference Guide

You also want an ePaper? Increase the reach of your titles
YUMPU automatically turns print PDFs into web optimized ePapers that Google loves.
Intel® <strong>Trace</strong> <strong>Analyzer</strong> <strong>User's</strong> <strong>Reference</strong> <strong>Guide</strong><br />
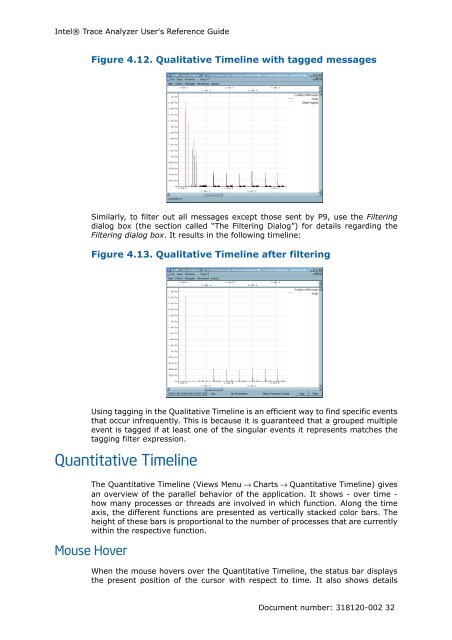
Figure 4.12. Qualitative Timeline with tagged messages<br />
Similarly, to filter out all messages except those sent by P9, use the Filtering<br />
dialog box (the section called “The Filtering Dialog”) for details regarding the<br />
Filtering dialog box. It results in the following timeline:<br />
Figure 4.13. Qualitative Timeline after filtering<br />
Using tagging in the Qualitative Timeline is an efficient way to find specific events<br />
that occur infrequently. This is because it is guaranteed that a grouped multiple<br />
event is tagged if at least one of the singular events it represents matches the<br />
tagging filter expression.<br />
Quantitative Timeline<br />
The Quantitative Timeline (Views Menu → Charts → Quantitative Timeline) gives<br />
an overview of the parallel behavior of the application. It shows - over time -<br />
how many processes or threads are involved in which function. Along the time<br />
axis, the different functions are presented as vertically stacked color bars. The<br />
height of these bars is proportional to the number of processes that are currently<br />
within the respective function.<br />
Mouse Hover<br />
When the mouse hovers over the Quantitative Timeline, the status bar displays<br />
the present position of the cursor with respect to time. It also shows details<br />
Document number: 318120-002 32