Intel® Trace Analyzer User's Reference Guide
Intel® Trace Analyzer User's Reference Guide
Intel® Trace Analyzer User's Reference Guide

Create successful ePaper yourself
Turn your PDF publications into a flip-book with our unique Google optimized e-Paper software.
Intel® <strong>Trace</strong> <strong>Analyzer</strong> <strong>User's</strong> <strong>Reference</strong> <strong>Guide</strong><br />
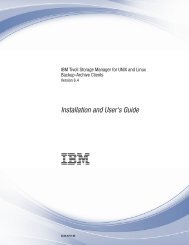
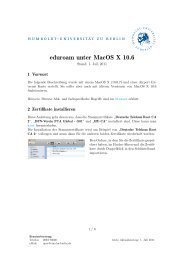
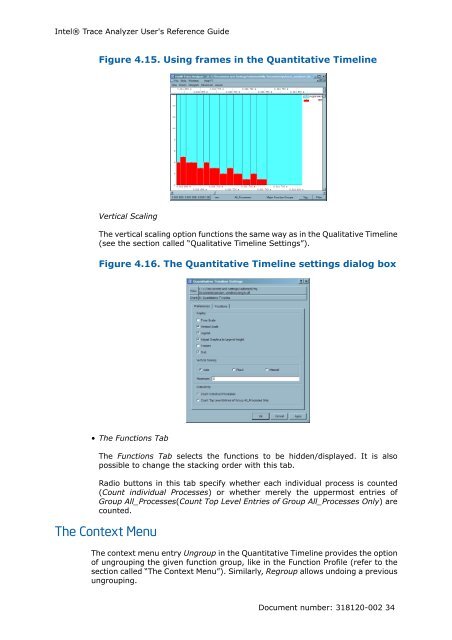
Figure 4.15. Using frames in the Quantitative Timeline<br />
Vertical Scaling<br />
The vertical scaling option functions the same way as in the Qualitative Timeline<br />
(see the section called “Qualitative Timeline Settings”).<br />
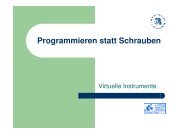
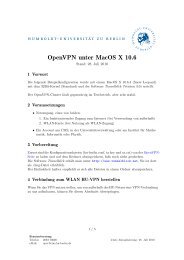
Figure 4.16. The Quantitative Timeline settings dialog box<br />
• The Functions Tab<br />
The Functions Tab selects the functions to be hidden/displayed. It is also<br />
possible to change the stacking order with this tab.<br />
Radio buttons in this tab specify whether each individual process is counted<br />
(Count individual Processes) or whether merely the uppermost entries of<br />
Group All_Processes(Count Top Level Entries of Group All_Processes Only) are<br />
counted.<br />
The Context Menu<br />
The context menu entry Ungroup in the Quantitative Timeline provides the option<br />
of ungrouping the given function group, like in the Function Profile (refer to the<br />
section called “The Context Menu”). Similarly, Regroup allows undoing a previous<br />
ungrouping.<br />
Document number: 318120-002 34