Intel® Trace Analyzer User's Reference Guide
Intel® Trace Analyzer User's Reference Guide
Intel® Trace Analyzer User's Reference Guide

Create successful ePaper yourself
Turn your PDF publications into a flip-book with our unique Google optimized e-Paper software.
Intel® <strong>Trace</strong> <strong>Analyzer</strong> <strong>User's</strong> <strong>Reference</strong> <strong>Guide</strong><br />
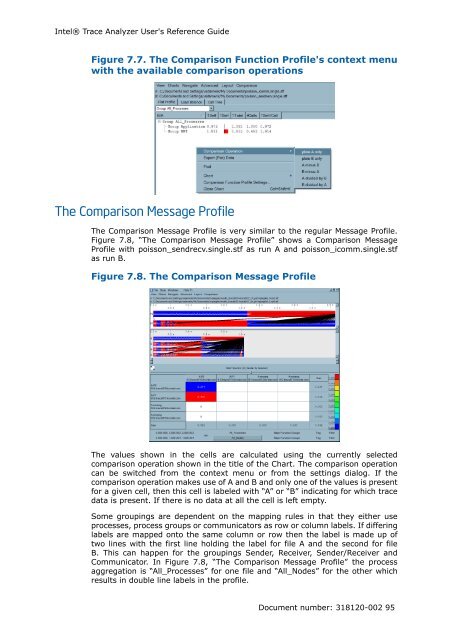
Figure 7.7. The Comparison Function Profile's context menu<br />
with the available comparison operations<br />
The Comparison Message Profile<br />
The Comparison Message Profile is very similar to the regular Message Profile.<br />
Figure 7.8, “The Comparison Message Profile” shows a Comparison Message<br />
Profile with poisson_sendrecv.single.stf as run A and poisson_icomm.single.stf<br />
as run B.<br />
Figure 7.8. The Comparison Message Profile<br />
The values shown in the cells are calculated using the currently selected<br />
comparison operation shown in the title of the Chart. The comparison operation<br />
can be switched from the context menu or from the settings dialog. If the<br />
comparison operation makes use of A and B and only one of the values is present<br />
for a given cell, then this cell is labeled with “A” or “B” indicating for which trace<br />
data is present. If there is no data at all the cell is left empty.<br />
Some groupings are dependent on the mapping rules in that they either use<br />
processes, process groups or communicators as row or column labels. If differing<br />
labels are mapped onto the same column or row then the label is made up of<br />
two lines with the first line holding the label for file A and the second for file<br />
B. This can happen for the groupings Sender, Receiver, Sender/Receiver and<br />
Communicator. In Figure 7.8, “The Comparison Message Profile” the process<br />
aggregation is “All_Processes” for one file and “All_Nodes” for the other which<br />
results in double line labels in the profile.<br />
Document number: 318120-002 95