Intel® Trace Analyzer User's Reference Guide
Intel® Trace Analyzer User's Reference Guide
Intel® Trace Analyzer User's Reference Guide

Create successful ePaper yourself
Turn your PDF publications into a flip-book with our unique Google optimized e-Paper software.
Intel® <strong>Trace</strong> <strong>Analyzer</strong> <strong>User's</strong> <strong>Reference</strong> <strong>Guide</strong><br />
The Hide option in the context menu conceals the chosen activity. To unhide all the<br />
hidden items, use the check boxes in the Functions tab of the Settings Dialog box.<br />
Figure 4.17. Quantitative Timeline: context menu<br />
The Move Group entry in the context menu changes the position of the different<br />
groups. The opted group can be moved to the top, to the bottom, upward by one<br />
position or downward by one position. Click on the legend to obtain a context<br />
menu with these options.<br />
The other context menu entries are explained in the section called “Common<br />
Chart Features”.<br />
Filtering and Tagging<br />
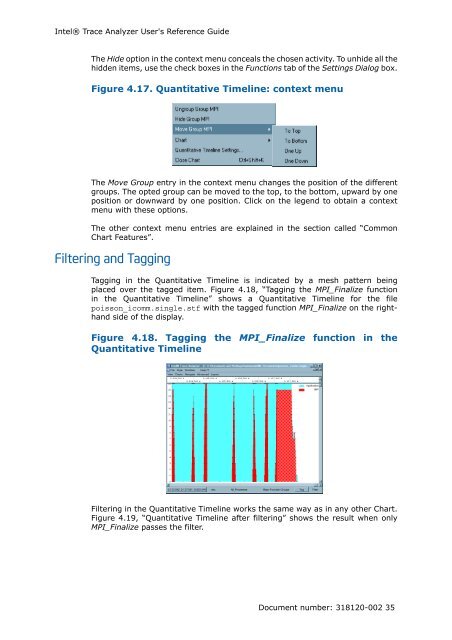
Tagging in the Quantitative Timeline is indicated by a mesh pattern being<br />
placed over the tagged item. Figure 4.18, “Tagging the MPI_Finalize function<br />
in the Quantitative Timeline” shows a Quantitative Timeline for the file<br />
poisson_icomm.single.stf with the tagged function MPI_Finalize on the righthand<br />
side of the display.<br />
Figure 4.18. Tagging the MPI_Finalize function in the<br />
Quantitative Timeline<br />
Filtering in the Quantitative Timeline works the same way as in any other Chart.<br />
Figure 4.19, “Quantitative Timeline after filtering” shows the result when only<br />
MPI_Finalize passes the filter.<br />
Document number: 318120-002 35