- Page 1 and 2:
q AMPER, S.A. and Subsidiaries Cons
- Page 3 and 4:
AMPER, S.A. AND SUBSIDIARIES CONSOL
- Page 5 and 6:
AMPER, S.A. AND SUBSIDIARIES CONSOL
- Page 7 and 8:
AMPER, S.A. AND SUBSIDIARIES CONSOL
- Page 9 and 10:
• In accordance with IFRSs, these
- Page 11 and 12:
The consolidated financial statemen
- Page 13 and 14:
a. Assets and liabilities: applying
- Page 15 and 16:
The Group’s share in non-controll
- Page 17 and 18:
The criteria used to recognise impa
- Page 19 and 20:
e) Financial instruments Financial
- Page 21 and 22:
Likewise, the Group needs to effect
- Page 23 and 24:
At the end of 2011 a number of lega
- Page 25 and 26:
Changes in deferred tax assets or l
- Page 27 and 28:
) Compensation for dismissal In acc
- Page 29 and 30:
4. Business Combinations and Goodwi
- Page 31 and 32:
The Group carries out tests on impa
- Page 33 and 34:
For the cash-generating unit “Tel
- Page 35 and 36:
Accumulated amortisation Balance at
- Page 37 and 38:
Group companies consolidated under
- Page 39 and 40: 10. Trade and other receivables The
- Page 41 and 42: This reserve will only be used unde
- Page 43 and 44: The amount of variation in scope of
- Page 45 and 46: The breakdown of bank financing at
- Page 47 and 48: At 31 December 2011, Group companie
- Page 49 and 50: Provincial Appeal Court also ordere
- Page 51 and 52: 17. Business and geographical segme
- Page 53 and 54: (Thousands of Euros) YEAR 2011 Defe
- Page 55 and 56: Inter-segment sales are made at pre
- Page 57 and 58: The methodology used to establish t
- Page 59 and 60: 19. Tax affaires Most of the compan
- Page 61 and 62: Company 31.12.09 Additions Scope va
- Page 63 and 64: At 31 December 2011 and 2010, the G
- Page 65 and 66: Remuneration to members of the Boar
- Page 67 and 68: 26. Other contingencies The Amper G
- Page 69 and 70: 27. Subsidiaries Below we present d
- Page 71 and 72: Bluesky Samoa Limited (Samoa) Samoa
- Page 73 and 74: AMPER, S.A. and Subsidiary Corporat
- Page 75 and 76: Defence Communications and Security
- Page 77 and 78: Outlook Despite the outlook of unce
- Page 79 and 80: for an amount of 92 Million Euros,
- Page 81 and 82: Spain The table reflects the data f
- Page 83 and 84: In Brazil, Amper was awarded the su
- Page 85 and 86: Strategic cooperation agreements In
- Page 87 and 88: RESEARCH AND DEVELOPMENT Amper, in
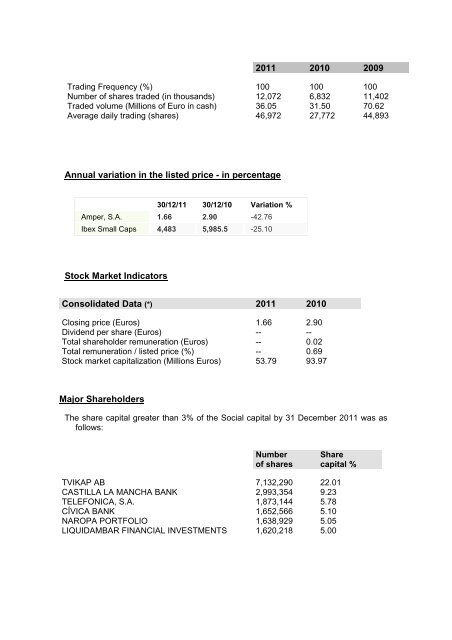
- Page 89: • The last listed price was 1.66
- Page 93 and 94: ANNUAL CORPORATE GOVERNANCE REPORT
- Page 95 and 96: Specify the most significant change
- Page 97 and 98: NO Specify whether the Company is a
- Page 99 and 100: address a public bid under 6/2007 A
- Page 101 and 102: EXTERNAL NOMINEE DIRECTORS Name or
- Page 103 and 104: Specify why they cannot be consider
- Page 105 and 106: B.1.10 With regard to the recommend
- Page 107 and 108: Type of Directors By company By gro
- Page 109 and 110: Process whereby the compensation of
- Page 111 and 112: - To propose the system of remunera
- Page 113 and 114: The Audit and Control Committee wil
- Page 115 and 116: NO B.1.25 Specify if the Articles o
- Page 117 and 118: B.1.32 Explain, where appropriate,
- Page 119 and 120: B.1.38 Specify whether the Audit Re
- Page 121 and 122: the Law on Public Limited Companies
- Page 123 and 124: Brief description ORGANISATIONAL AN
- Page 125 and 126: Name of the Committee APPOINTMENTS
- Page 127 and 128: The Committees of the Board of Dire
- Page 129 and 130: D.1 Description of the risk policy
- Page 131 and 132: equired, its renewal or non renewal
- Page 133 and 134: YES Specify the measures adopted Th
- Page 135 and 136: Amper, S A losses for the fiscal ye
- Page 137 and 138: Beneficiaries: The Managing Directo
- Page 139 and 140: Likewise, in its session of 25 May
- Page 141 and 142:
Not applicable 3. Although Commerci
- Page 143 and 144:
the directors concerned, in additio
- Page 145 and 146:
See caption: B.1.21 Not applicable
- Page 147 and 148:
Complies 28. The companies must mak
- Page 149 and 150:
c) Main characteristics of occupati
- Page 151 and 152:
of the participation in the differe
- Page 153 and 154:
a) To submit proposals with regard
- Page 155 and 156:
G - OTHER INFORMATION OF INTEREST I
- Page 157 and 158:
APPENDIX TO THE ANNUAL CORPORATE GO
- Page 159 and 160:
- In the case of all other employee
- Page 161 and 162:
changes approved, as well as formal
- Page 163 and 164:
EVALUATING RISKS IN FINANCIAL INFOR
- Page 165 and 166:
The descriptions cover controls for
- Page 167 and 168:
The manual establishes that its upd
- Page 169 and 170:
A description of the scope of the e
- Page 171 and 172:
KPMG KPMG Auditores S.L Edificio To
- Page 173 and 174:
3. Review the explanatory documenta
- Page 175 and 176:
Principal Companies of the Amper Gr
- Page 177 and 178:
AMPER, S.A. Balance Sheets (Thousan
- Page 179 and 180:
AMPER PROGRAMAS DE ELECTRÓNICA Y C
- Page 181 and 182:
AMPER SISTEMAS, S.A. (Unipersonal)
- Page 183 and 184:
HEMISFERIO NORTE BRASIL, S. L. (Uni
- Page 185 and 186:
GRUPO MEDIDATA INFORMÁTICA Balance
- Page 187 and 188:
EPICOM, S.A. Balance Sheets (Thousa
- Page 189 and 190:
LANDATA COMUNICACIONES DE EMPRESA,
- Page 191 and 192:
AMPER GROUP Balance Sheets (Thousan
- Page 193 and 194:
eLandia INTERNATIONAL, INC. Balance
- Page 195 and 196:
7. Delegation, in favour of the Boa
- Page 197 and 198:
a) By the subsequent and express re
- Page 199 and 200:
In accordance with the provisions s
- Page 201 and 202:
Resolutions relating to item three
- Page 203 and 204:
Shareholders representing at least
- Page 205 and 206:
members are present or represented
- Page 207 and 208:
This Regulation aims to: a) Make pu
- Page 209 and 210:
• Significant events notified to
- Page 211 and 212:
information could be harmful to the
- Page 213 and 214:
Article 7. Convening of a meeting a
- Page 215 and 216:
Article 11. Agenda The agenda shall
- Page 217 and 218:
esolution previously adopted to suc
- Page 219 and 220:
Article 28: Publication Following i
- Page 221 and 222:
other existing paid-up share capita
- Page 223 and 224:
each issue or issue tranche; howeve
- Page 225 and 226:
debentures and bonds and warrants,
- Page 227 and 228:
The present proposal may be subject
- Page 229 and 230:
The Report of the Board of Director
- Page 231 and 232:
Article 16 B: Right to information
- Page 233 and 234:
The shareholders representing at le
- Page 235 and 236:
The Board of Directors shall meet w
- Page 237 and 238:
All this makes it advisable to adap
- Page 239 and 240:
CURRENT DRAFT PROPOSED AMENDMENT Pr
- Page 241 and 242:
the last financial year, at least.
- Page 243 and 244:
esolutions to be adopted and the do
- Page 245 and 246:
call shall be forwarded by the comp
- Page 247 and 248:
convened: - The minimum period requ
- Page 249 and 250:
of time, as well as the good order
- Page 251 and 252:
of signature considered appropriate
- Page 253 and 254:
through the timely notice of signif
- Page 255 and 256:
In general, it is not possible to p
- Page 257 and 258:
REPORT OF THE BOARD OF DIRECTORS OF
- Page 259 and 260:
(g) (h) (i) (j) The nature of, perp
- Page 261 and 262:
exchangeable fixed income securitie
- Page 263 and 264:
onds and shall be reported in the f
- Page 265 and 266:
upon the termination or relocation
- Page 267 and 268:
Article 13) The General Meetings ma
- Page 269 and 270:
The shareholders, who are entitled
- Page 271 and 272:
the right to cast their vote from a
- Page 273 and 274:
on any issues that may put at risk
- Page 275 and 276:
may not refuse the recruitment unle
- Page 277 and 278:
along with the functions and powers
- Page 279 and 280:
ACTIVITY REPORT OF THE APPOINTMENTS
- Page 281 and 282:
- Allowance of the Board Members fo
- Page 283 and 284:
Mr. Ignacio Javier López del Hierr
- Page 285 and 286:
ACTIVITY REPORT OF THE AUDIT AND CO
- Page 287 and 288:
ACTIVITY REPORT OF THE AUDIT AND CO
- Page 289 and 290:
ACTIVITY REPORT OF THE AUDIT AND CO
- Page 291 and 292:
ACTIVITY REPORT OF THE AUDIT AND CO
- Page 293 and 294:
ACTIVITY REPORT OF THE AUDIT AND CO
- Page 295 and 296:
Was appointed Board Member on 25 Ja
- Page 297 and 298:
Changes produced in the Audit and C
- Page 299 and 300:
It also involves the acquisition, o
- Page 301 and 302:
Information and Consultations The d
- Page 303:
AMPER GROUP INNOVATION COMMITTEE fr