

Download PDF - Anchor Environmental
Download PDF - Anchor Environmental
Download PDF - Anchor Environmental

Create successful ePaper yourself
Turn your PDF publications into a flip-book with our unique Google optimized e-Paper software.
Turnover was estimated as follows:<br />
1. Method 1: Each type of tourism enterprise was allocated a size factor as an estimate of the<br />
level of turnover relative to the typical model, based on general experience of the team.<br />
2. Method 2: As above, except that the size factor was estimated individually for each enterprise<br />
by members of one of the larger tourism companies (Dave van Smeerdijk and colleagues at<br />
Wilderness Safaris).<br />
3. Method 3: Data were gathered on the number of beds, and the average prices of as many of<br />
the enterprises as possible. Average values were interpolated for budget camps, luxury<br />
camps, guesthouses and hunting camps. Occupancy rates were assumed to be 40% for<br />
hotels and budget camps, 35% for hunting camps, and 50 – 85% for luxury camps, based on<br />
discussions with camp operators.<br />
A portion of this turnover was then attributed to the delta. For hotels, this was assumed to be 25%<br />
(since they also attract considerable government business), for guesthouses, 60%, and for camps,<br />
100% (since these are located within the delta). About 50% of turnover by mobile tour operators was<br />
assumed to be attributed to the delta, based on typical itineraries. Turnover values were divided into<br />
non-consumptive tourism, safari hunting tourism, and CBNRM. Total CBNRM turnover includes that of<br />
the lodges, camps in those areas, as well as that of community trusts (listed as 'Other CBNRM'<br />
income).<br />
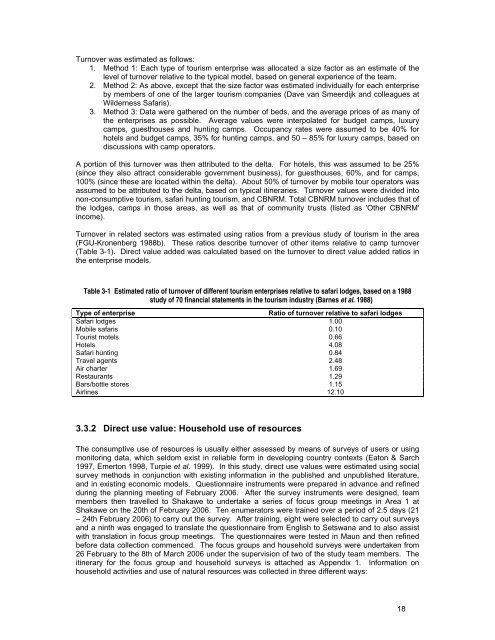
Turnover in related sectors was estimated using ratios from a previous study of tourism in the area<br />
(FGU-Kronenberg 1988b). These ratios describe turnover of other items relative to camp turnover<br />
(Table 3-1). Direct value added was calculated based on the turnover to direct value added ratios in<br />
the enterprise models.<br />
Table 3-1 Estimated ratio of turnover of different tourism enterprises relative to safari lodges, based on a 1988<br />
study of 70 financial statements in the tourism industry (Barnes et al. 1988)<br />
Type of enterprise<br />
Ratio of turnover relative to safari lodges<br />
Safari lodges 1.00<br />
Mobile safaris 0.10<br />
Tourist motels 0.66<br />
Hotels 4.08<br />
Safari hunting 0.84<br />
Travel agents 2.48<br />
Air charter 1.69<br />
Restaurants 1.29<br />
Bars/bottle stores 1.15<br />
Airlines 12.10<br />
3.3.2 Direct use value: Household use of resources<br />
The consumptive use of resources is usually either assessed by means of surveys of users or using<br />
monitoring data, which seldom exist in reliable form in developing country contexts (Eaton & Sarch<br />
1997, Emerton 1998, Turpie et al. 1999). In this study, direct use values were estimated using social<br />
survey methods in conjunction with existing information in the published and unpublished literature,<br />
and in existing economic models. Questionnaire instruments were prepared in advance and refined<br />
during the planning meeting of February 2006. After the survey instruments were designed, team<br />
members then travelled to Shakawe to undertake a series of focus group meetings in Area 1 at<br />
Shakawe on the 20th of February 2006. Ten enumerators were trained over a period of 2.5 days (21<br />
– 24th February 2006) to carry out the survey. After training, eight were selected to carry out surveys<br />
and a ninth was engaged to translate the questionnaire from English to Setswana and to also assist<br />
with translation in focus group meetings. The questionnaires were tested in Maun and then refined<br />
before data collection commenced. The focus groups and household surveys were undertaken from<br />
26 February to the 8th of March 2006 under the supervision of two of the study team members. The<br />
itinerary for the focus group and household surveys is attached as Appendix 1. Information on<br />
household activities and use of natural resources was collected in three different ways:<br />
18


