

Download PDF - Anchor Environmental
Download PDF - Anchor Environmental
Download PDF - Anchor Environmental

Create successful ePaper yourself
Turn your PDF publications into a flip-book with our unique Google optimized e-Paper software.
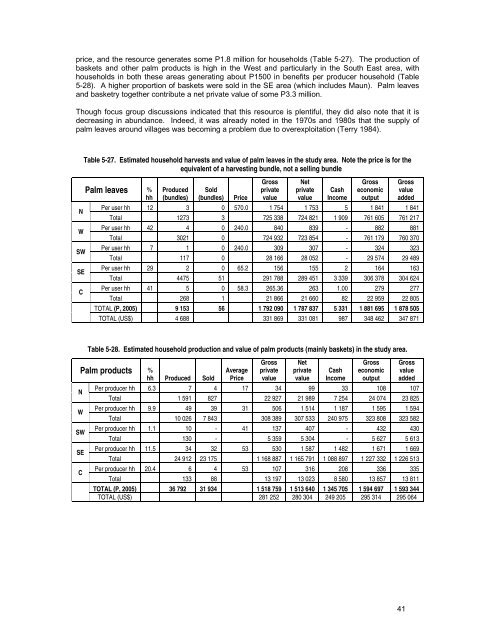
price, and the resource generates some P1.8 million for households (Table 5-27). The production of<br />
baskets and other palm products is high in the West and particularly in the South East area, with<br />
households in both these areas generating about P1500 in benefits per producer household (Table<br />
5-28). A higher proportion of baskets were sold in the SE area (which includes Maun). Palm leaves<br />
and basketry together contribute a net private value of some P3.3 million.<br />
Though focus group discussions indicated that this resource is plentiful, they did also note that it is<br />
decreasing in abundance. Indeed, it was already noted in the 1970s and 1980s that the supply of<br />
palm leaves around villages was becoming a problem due to overexploitation (Terry 1984).<br />
N<br />
W<br />
SW<br />
SE<br />
C<br />
Table 5-27. Estimated household harvests and value of palm leaves in the study area. Note the price is for the<br />
equivalent of a harvesting bundle, not a selling bundle<br />
Produced<br />
(bundles)<br />
Sold<br />
(bundles) Price<br />
Gross<br />
private<br />
value<br />
Net<br />
private<br />
value<br />
Cash<br />
Income<br />
Gross<br />
economic<br />
output<br />
Gross<br />
value<br />
added<br />
Per user hh 12 3 0 570.0 1 754 1 753 5 1 841 1 841<br />
Palm leaves %<br />
hh<br />
Total 1273 3 725 338 724 821 1 909 761 605 761 217<br />
Per user hh 42 4 0 240.0 840 839 - 882 881<br />
Total 3021 0 724 932 723 854 - 761 179 760 370<br />
Per user hh 7 1 0 240.0 309 307 - 324 323<br />
Total 117 0 28 166 28 052 - 29 574 29 489<br />
Per user hh 29 2 0 65.2 156 155 2 164 163<br />
Total 4475 51 291 788 289 451 3 339 306 378 304 624<br />
Per user hh 41 5 0 58.3 265.36 263 1.00 279 277<br />
Total 268 1 21 866 21 660 82 22 959 22 805<br />
TOTAL (P, 2005) 9 153 56 1 792 090 1 787 837 5 331 1 881 695 1 878 505<br />
TOTAL (US$) 4 688 331 869 331 081 987 348 462 347 871<br />
Table 5-28. Estimated household production and value of palm products (mainly baskets) in the study area.<br />
Palm products %<br />
hh Produced Sold<br />
N<br />
W<br />
SW<br />
SE<br />
C<br />
Average<br />
Price<br />
Gross<br />
private<br />
value<br />
Net<br />
private<br />
value<br />
Cash<br />
Income<br />
Gross<br />
economic<br />
output<br />
Gross<br />
value<br />
added<br />
Per producer hh 6.3 7 4 17 34 99 33 108 107<br />
Total 1 591 827 22 927 21 989 7 254 24 074 23 825<br />
Per producer hh 9.9 49 39 31 506 1 514 1 187 1 595 1 594<br />
Total 10 026 7 843 308 389 307 533 240 975 323 808 323 582<br />
Per producer hh 1.1 10 - 41 137 407 - 432 430<br />
Total 130 - 5 359 5 304 - 5 627 5 613<br />
Per producer hh 11.5 34 32 53 530 1 587 1 482 1 671 1 669<br />
Total 24 912 23 175 1 168 887 1 165 791 1 088 897 1 227 332 1 226 513<br />
Per producer hh 20.4 6 4 53 107 316 208 336 335<br />
Total 133 88 13 197 13 023 8 580 13 857 13 811<br />
TOTAL (P, 2005) 36 792 31 934 1 518 759 1 513 640 1 345 705 1 594 697 1 593 344<br />
TOTAL (US$) 281 252 280 304 249 205 295 314 295 064<br />
41


