

Download PDF - Anchor Environmental
Download PDF - Anchor Environmental
Download PDF - Anchor Environmental

Create successful ePaper yourself
Turn your PDF publications into a flip-book with our unique Google optimized e-Paper software.
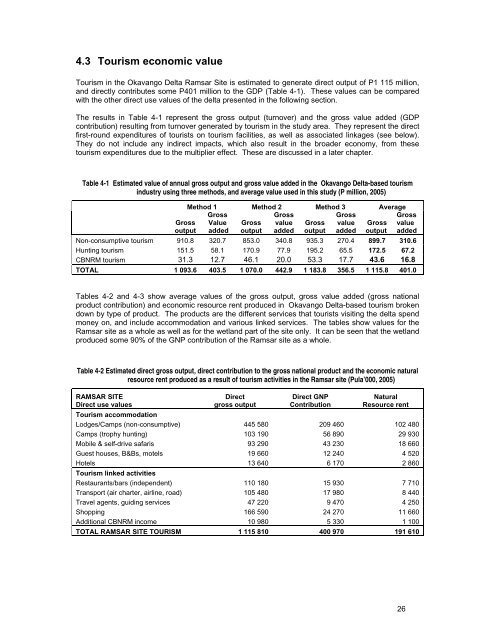
4.3 Tourism economic value<br />
Tourism in the Okavango Delta Ramsar Site is estimated to generate direct output of P1 115 million,<br />
and directly contributes some P401 million to the GDP (Table 4-1). These values can be compared<br />
with the other direct use values of the delta presented in the following section.<br />
The results in Table 4-1 represent the gross output (turnover) and the gross value added (GDP<br />
contribution) resulting from turnover generated by tourism in the study area. They represent the direct<br />
first-round expenditures of tourists on tourism facilities, as well as associated linkages (see below).<br />
They do not include any indirect impacts, which also result in the broader economy, from these<br />
tourism expenditures due to the multiplier effect. These are discussed in a later chapter.<br />
Table 4-1 Estimated value of annual gross output and gross value added in the Okavango Delta-based tourism<br />
industry using three methods, and average value used in this study (P million, 2005)<br />
Gross<br />
output<br />
Method 1 Method 2 Method 3 Average<br />
Gross<br />
Gross<br />
Gross<br />
Value Gross value Gross value Gross<br />
added output added output added output<br />
Gross<br />
value<br />
added<br />
Non-consumptive tourism 910.8 320.7 853.0 340.8 935.3 270.4 899.7 310.6<br />
Hunting tourism 151.5 58.1 170.9 77.9 195.2 65.5 172.5 67.2<br />
CBNRM tourism 31.3 12.7 46.1 20.0 53.3 17.7 43.6 16.8<br />
TOTAL 1 093.6 403.5 1 070.0 442.9 1 183.8 356.5 1 115.8 401.0<br />
Tables 4-2 and 4-3 show average values of the gross output, gross value added (gross national<br />
product contribution) and economic resource rent produced in Okavango Delta-based tourism broken<br />
down by type of product. The products are the different services that tourists visiting the delta spend<br />
money on, and include accommodation and various linked services. The tables show values for the<br />
Ramsar site as a whole as well as for the wetland part of the site only. It can be seen that the wetland<br />
produced some 90% of the GNP contribution of the Ramsar site as a whole.<br />
Table 4-2 Estimated direct gross output, direct contribution to the gross national product and the economic natural<br />
resource rent produced as a result of tourism activities in the Ramsar site (Pula’000, 2005)<br />
RAMSAR SITE<br />
Direct use values<br />
Direct<br />
gross output<br />
Direct GNP<br />
Contribution<br />
Natural<br />
Resource rent<br />
Tourism accommodation<br />
Lodges/Camps (non-consumptive) 445 580 209 460 102 480<br />
Camps (trophy hunting) 103 190 56 890 29 930<br />
Mobile & self-drive safaris 93 290 43 230 18 660<br />
Guest houses, B&Bs, motels 19 660 12 240 4 520<br />
Hotels 13 640 6 170 2 860<br />
Tourism linked activities<br />
Restaurants/bars (independent) 110 180 15 930 7 710<br />
Transport (air charter, airline, road) 105 480 17 980 8 440<br />
Travel agents, guiding services 47 220 9 470 4 250<br />
Shopping 166 590 24 270 11 660<br />
Additional CBNRM income 10 980 5 330 1 100<br />
TOTAL RAMSAR SITE TOURISM 1 115 810 400 970 191 610<br />
26


