- Page 2:
Exchange Rate Economics Exchange Ra
- Page 5 and 6:
Firstpublished2007 by Routledge 2Pa
- Page 8 and 9:
Contents List of figures List of ta
- Page 10 and 11:
Figures 1.1 The balance of payments
- Page 12 and 13:
Figures 13.6 Fourth generation spec
- Page 14:
Preface This book is the second edi
- Page 17 and 18:
2 Introduction Although the textboo
- Page 19 and 20:
4 Introduction (orders to buy/sell
- Page 21 and 22:
6 Introduction Table 1.3 Currency d
- Page 23 and 24:
8 Introduction a truly flexible exc
- Page 25 and 26:
10 Introduction this has to be sati
- Page 27 and 28:
12 Introduction likely that the rel
- Page 29 and 30:
14 Introduction or F (1 + i) = S (1
- Page 31 and 32:
16 Introduction Consider now a fall
- Page 33 and 34:
18 Introduction The empirical evide
- Page 35 and 36:
20 Introduction (mean and variance)
- Page 37 and 38:
22 Introduction (a) (b) 0.3 0.25 0.
- Page 39 and 40:
24 Introduction clusters or that it
- Page 41 and 42:
26 Introduction 0.1 0.05 0 -0.05 -0
- Page 43 and 44:
28 Introduction 1.9 Exchange rate r
- Page 45 and 46:
30 Introduction fixed versus flexib
- Page 47 and 48:
32 Introduction influences. For exa
- Page 49 and 50:
34 Introduction 1.11 The determinan
- Page 51 and 52:
36 Introduction In the standard OCA
- Page 53 and 54:
38 Introduction most transactions i
- Page 55 and 56:
40 Purchasing power parity and the
- Page 57 and 58:
42 Purchasing power parity and the
- Page 59 and 60:
44 Purchasing power parity and the
- Page 61 and 62:
46 Purchasing power parity and the
- Page 63 and 64:
48 Purchasing power parity and the
- Page 65 and 66:
50 Purchasing power parity and the
- Page 67 and 68:
52 Purchasing power parity and the
- Page 69 and 70:
54 Purchasing power parity and the
- Page 71 and 72:
56 Purchasing power parity and the
- Page 73 and 74:
58 Purchasing power parity and the
- Page 75 and 76:
60 Purchasing power parity and the
- Page 77 and 78:
62 Purchasing power parity and the
- Page 79 and 80:
64 Purchasing power parity and the
- Page 81 and 82:
66 Purchasing power parity and the
- Page 83 and 84:
3 The economics of the PPP puzzle I
- Page 85 and 86:
70 The economics of the PPP puzzle
- Page 87 and 88:
72 The economics of the PPP puzzle
- Page 89 and 90:
74 The economics of the PPP puzzle
- Page 91 and 92:
76 The economics of the PPP puzzle
- Page 93 and 94:
78 The economics of the PPP puzzle
- Page 95 and 96:
80 The economics of the PPP puzzle
- Page 97 and 98:
82 The economics of the PPP puzzle
- Page 99 and 100:
84 The economics of the PPP puzzle
- Page 101 and 102:
86 The economics of the PPP puzzle
- Page 103 and 104:
88 The economics of the PPP puzzle
- Page 105 and 106:
90 The economics of the PPP puzzle
- Page 107 and 108:
92 The economics of the PPP puzzle
- Page 109 and 110:
4 The flexible price monetary appro
- Page 111 and 112:
96 The flexible price monetary appr
- Page 113 and 114:
98 The flexible price monetary appr
- Page 115 and 116:
100 The flexible price monetary app
- Page 117 and 118:
102 The flexible price monetary app
- Page 119 and 120:
104 The flexible price monetary app
- Page 121 and 122:
5 The sticky-price monetary model I
- Page 123 and 124:
108 The sticky-price monetary model
- Page 125 and 126:
110 The sticky-price monetary model
- Page 127 and 128:
112 The sticky-price monetary model
- Page 129 and 130:
114 The sticky-price monetary model
- Page 131 and 132:
116 The sticky-price monetary model
- Page 133 and 134:
118 The sticky-price monetary model
- Page 135 and 136:
120 The sticky-price monetary model
- Page 137 and 138:
122 The sticky-price monetary model
- Page 139 and 140:
124 The sticky-price monetary model
- Page 141 and 142:
126 The sticky-price monetary model
- Page 143 and 144:
128 The sticky-price monetary model
- Page 145 and 146:
130 The sticky-price monetary model
- Page 147 and 148:
132 The sticky-price monetary model
- Page 149 and 150:
6 The monetaryapproach to the excha
- Page 151 and 152:
136 Empirical evidence on the monet
- Page 153 and 154:
138 Empirical evidence on the monet
- Page 155 and 156:
140 Empirical evidence on the monet
- Page 157 and 158:
142 Empirical evidence on the monet
- Page 159 and 160:
144 Empirical evidence on the monet
- Page 161 and 162:
146 Empirical evidence on the monet
- Page 163 and 164:
148 Empirical evidence on the monet
- Page 165 and 166:
150 Empirical evidence on the monet
- Page 167 and 168:
152 Empirical evidence on the monet
- Page 169 and 170:
Table 6.5 SEM equations: United Kin
- Page 171 and 172:
156 Empirical evidence on the monet
- Page 173 and 174:
158 Empirical evidence on the monet
- Page 175 and 176:
160 Empirical evidence on the monet
- Page 177 and 178:
162 Empirical evidence on the monet
- Page 179 and 180:
164 Empirical evidence on the monet
- Page 181 and 182:
7 Currencysubstitution models and t
- Page 183 and 184:
168 Currency substitution and portf
- Page 185 and 186:
170 Currency substitution and portf
- Page 187 and 188:
172 Currency substitution and portf
- Page 189 and 190:
174 Currency substitution and portf
- Page 191 and 192:
176 Currency substitution and portf
- Page 193 and 194:
178 Currency substitution and portf
- Page 195 and 196:
180 Currency substitution and portf
- Page 197 and 198:
182 Currency substitution and portf
- Page 199 and 200:
184 Currency substitution and portf
- Page 201 and 202:
186 Currency substitution and portf
- Page 203 and 204:
188 Currency substitution and portf
- Page 205 and 206:
190 Currency substitution and portf
- Page 207 and 208:
192 Currency substitution and portf
- Page 209 and 210:
194 Currency substitution and portf
- Page 211 and 212:
196 Currency substitution and portf
- Page 213 and 214:
198 Currency substitution and portf
- Page 215 and 216:
200 Real exchange rate determinatio
- Page 217 and 218:
202 Real exchange rate determinatio
- Page 219 and 220:
204 Real exchange rate determinatio
- Page 221 and 222:
206 Real exchange rate determinatio
- Page 223 and 224:
208 Real exchange rate determinatio
- Page 225 and 226:
210 Real exchange rate determinatio
- Page 227 and 228:
212 Real exchange rate determinatio
- Page 229 and 230:
214 Real exchange rate determinatio
- Page 231 and 232:
216 Real exchange rate determinatio
- Page 233 and 234:
218 Real exchange rate determinatio
- Page 235 and 236:
220 Real exchange rate determinatio
- Page 237 and 238:
222 Real exchange rate determinatio
- Page 239 and 240:
224 Real exchange rate determinatio
- Page 241 and 242:
226 Real exchange rate determinatio
- Page 243 and 244:
228 Equilibrium exchange rates rate
- Page 245 and 246:
230 Equilibrium exchange rates A nu
- Page 247 and 248:
232 Equilibrium exchange rates long
- Page 249 and 250:
234 Equilibrium exchange rates 5.1
- Page 251 and 252:
236 Equilibrium exchange rates term
- Page 253 and 254:
238 Equilibrium exchange rates 0.30
- Page 255 and 256:
240 Equilibrium exchange rates Detk
- Page 257 and 258:
242 Equilibrium exchange rates US i
- Page 259 and 260:
244 Equilibrium exchange rates The
- Page 261 and 262:
246 Equilibrium exchange rates 9.6.
- Page 263 and 264:
248 Equilibrium exchange rates 9.6.
- Page 265 and 266: 250 Equilibrium exchange rates Conc
- Page 267 and 268: 252 The new open economy macroecono
- Page 269 and 270: 254 The new open economy macroecono
- Page 271 and 272: 256 The new open economy macroecono
- Page 273 and 274: 258 The new open economy macroecono
- Page 275 and 276: 260 The new open economy macroecono
- Page 277 and 278: 262 The new open economy macroecono
- Page 279 and 280: 264 The new open economy macroecono
- Page 281 and 282: 266 The new open economy macroecono
- Page 283 and 284: 268 The new open economy macroecono
- Page 285 and 286: 270 The new open economy macroecono
- Page 287 and 288: 272 The new open economy macroecono
- Page 289 and 290: 11 The new open economy macroeconom
- Page 291 and 292: 276 The new open economy macroecono
- Page 293 and 294: 278 The new open economy macroecono
- Page 295 and 296: 280 The new open economy macroecono
- Page 297 and 298: 282 The new open economy macroecono
- Page 299 and 300: 284 The new open economy macroecono
- Page 301 and 302: 286 The new open economy macroecono
- Page 303 and 304: 288 The new open economy macroecono
- Page 305 and 306: 290 Target zone models 12.1 The bas
- Page 307 and 308: 292 Target zone models stochastic c
- Page 309 and 310: 294 Target zone models moves from 2
- Page 311 and 312: 296 Target zone models where A 1 an
- Page 313 and 314: 298 Target zone models expected dev
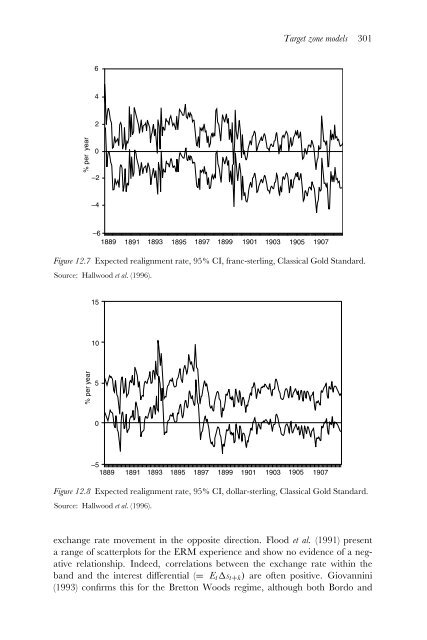
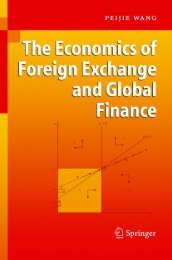
- Page 315: 300 Target zone models % expected d
- Page 319 and 320: 304 Target zone models for the DM-l
- Page 321 and 322: 306 Target zone models explicit ban
- Page 323 and 324: 308 Target zone models Table 12.1 F
- Page 325 and 326: 310 Target zone models short-term i
- Page 327 and 328: 312 Target zone models the UK short
- Page 329 and 330: 314 Speculative attack models and c
- Page 331 and 332: 316 Speculative attack models and c
- Page 333 and 334: 318 Speculative attack models and c
- Page 335 and 336: 320 Speculative attack models and c
- Page 337 and 338: 322 Speculative attack models and c
- Page 339 and 340: 324 Speculative attack models and c
- Page 341 and 342: 326 Speculative attack models and c
- Page 343 and 344: 328 Speculative attack models and c
- Page 345 and 346: 330 Speculative attack models and c
- Page 347 and 348: 332 Speculative attack models and c
- Page 349 and 350: 334 Speculative attack models and c
- Page 351 and 352: 336 Speculative attack models and c
- Page 353 and 354: 338 Speculative attack models and c
- Page 355 and 356: 340 Market microstructure approach
- Page 357 and 358: 342 Market microstructure approach
- Page 359 and 360: 344 Market microstructure approach
- Page 361 and 362: 346 Market microstructure approach
- Page 363 and 364: 348 Market microstructure approach
- Page 365 and 366: 350 Market microstructure approach
- Page 367 and 368:
352 Market microstructure approach
- Page 369 and 370:
354 Market microstructure approach
- Page 371 and 372:
356 Market microstructure approach
- Page 373 and 374:
358 Market microstructure approach
- Page 375 and 376:
360 Market microstructure approach
- Page 377 and 378:
362 Market microstructure approach
- Page 379 and 380:
364 Market microstructure approach
- Page 381 and 382:
366 Market microstructure approach
- Page 383 and 384:
368 Market microstructure approach
- Page 385 and 386:
15 Spot and forward exchange rates
- Page 387 and 388:
372 Spot and forward exchange rates
- Page 389 and 390:
374 Spot and forward exchange rates
- Page 391 and 392:
376 Spot and forward exchange rates
- Page 393 and 394:
378 Spot and forward exchange rates
- Page 395 and 396:
380 Spot and forward exchange rates
- Page 397 and 398:
382 Spot and forward exchange rates
- Page 399 and 400:
384 Spot and forward exchange rates
- Page 401 and 402:
386 Spot and forward exchange rates
- Page 403 and 404:
388 Spot and forward exchange rates
- Page 405 and 406:
390 Spot and forward exchange rates
- Page 407 and 408:
392 Spot and forward exchange rates
- Page 409 and 410:
394 Spot and forward exchange rates
- Page 411 and 412:
Notes 1 Introduction: some basic co
- Page 413 and 414:
398 Notes 4 Although the split betw
- Page 415 and 416:
400 Notes 3 The fact that the utili
- Page 417 and 418:
402 Notes 15 This result is familia
- Page 419 and 420:
404 Notes 6 Where ∫ ∞ vg(v) E(v
- Page 421 and 422:
406 References Artis,M. and M. Lewi
- Page 423 and 424:
408 References Bergin,P.,R. Glick a
- Page 425 and 426:
410 References Calvo,G.A. and C.A.
- Page 427 and 428:
412 References Clark,P.B. and R. Ma
- Page 429 and 430:
414 References Detken,C.,A. Dieppe,
- Page 431 and 432:
416 References Edwards,S. and I. Ma
- Page 433 and 434:
418 References Fischer,S. (2001),
- Page 435 and 436:
420 References Frieden,J.P.G. and E
- Page 437 and 438:
422 References Granger,C.W. and T.
- Page 439 and 440:
424 References Hooper,P. and J. Mor
- Page 441 and 442:
426 References Kearney,C. and R. Ma
- Page 443 and 444:
428 References Lewis,K. (1988),‘T
- Page 445 and 446:
430 References MacDonald,R. (2002),
- Page 447 and 448:
432 References Mark,N.C. (2001),Int
- Page 449 and 450:
434 References Obstfeld,M. and K. R
- Page 451 and 452:
436 References Roll,R. (1979),‘Vi
- Page 453 and 454:
438 References Tauchen,G.E. and M.
- Page 455 and 456:
Index Abadir,K. 389 Abuaf,N. 60 Adl
- Page 457 and 458:
442 Index Diba,B. 177-8 Dickey,D.A.
- Page 459 and 460:
444 Index Gagnon,J. 212 Gali,J. 128
- Page 461 and 462:
446 Index Miller,M.H. 120,123,128,1
- Page 463 and 464:
448 Index purchasing power parity (
- Page 465:
450 Index trade: interbank trade 34