Financial Sector Development in Africa: Opportunities ... - World Bank
Financial Sector Development in Africa: Opportunities ... - World Bank
Financial Sector Development in Africa: Opportunities ... - World Bank

Create successful ePaper yourself
Turn your PDF publications into a flip-book with our unique Google optimized e-Paper software.
10 Jarotschk<strong>in</strong><br />
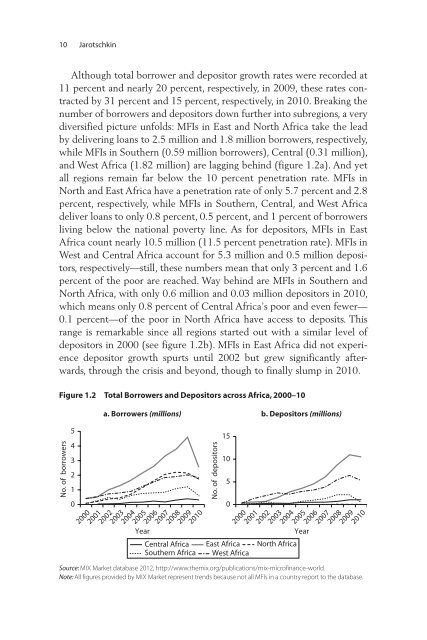
Although total borrower and depositor growth rates were recorded at<br />
11 percent and nearly 20 percent, respectively, <strong>in</strong> 2009, these rates contracted<br />
by 31 percent and 15 percent, respectively, <strong>in</strong> 2010. Break<strong>in</strong>g the<br />
number of borrowers and depositors down further <strong>in</strong>to subregions, a very<br />
diversified picture unfolds: MFIs <strong>in</strong> East and North <strong>Africa</strong> take the lead<br />
by deliver<strong>in</strong>g loans to 2.5 million and 1.8 million borrowers, respectively,<br />
while MFIs <strong>in</strong> Southern (0.59 million borrowers), Central (0.31 million),<br />
and West <strong>Africa</strong> (1.82 million) are lagg<strong>in</strong>g beh<strong>in</strong>d (figure 1.2a). And yet<br />
all regions rema<strong>in</strong> far below the 10 percent penetration rate. MFIs <strong>in</strong><br />
North and East <strong>Africa</strong> have a penetration rate of only 5.7 percent and 2.8<br />
percent, respectively, while MFIs <strong>in</strong> Southern, Central, and West <strong>Africa</strong><br />
deliver loans to only 0.8 percent, 0.5 percent, and 1 percent of borrowers<br />
liv<strong>in</strong>g below the national poverty l<strong>in</strong>e. As for depositors, MFIs <strong>in</strong> East<br />
<strong>Africa</strong> count nearly 10.5 million (11.5 percent penetration rate). MFIs <strong>in</strong><br />
West and Central <strong>Africa</strong> account for 5.3 million and 0.5 million depositors,<br />
respectively—still, these numbers mean that only 3 percent and 1.6<br />
percent of the poor are reached. Way beh<strong>in</strong>d are MFIs <strong>in</strong> Southern and<br />
North <strong>Africa</strong>, with only 0.6 million and 0.03 million depositors <strong>in</strong> 2010,<br />
which means only 0.8 percent of Central <strong>Africa</strong>’s poor and even fewer—<br />
0.1 percent—of the poor <strong>in</strong> North <strong>Africa</strong> have access to deposits. This<br />
range is remarkable s<strong>in</strong>ce all regions started out with a similar level of<br />
depositors <strong>in</strong> 2000 (see figure 1.2b). MFIs <strong>in</strong> East <strong>Africa</strong> did not experience<br />
depositor growth spurts until 2002 but grew significantly afterwards,<br />
through the crisis and beyond, though to f<strong>in</strong>ally slump <strong>in</strong> 2010.<br />
Figure 1.2 Total Borrowers and Depositors across <strong>Africa</strong>, 2000–10<br />
a. Borrowers (millions)<br />
b. Depositors (millions)<br />
No. of borrowers<br />
5<br />
4<br />
3<br />
2<br />
1<br />
0<br />
2000<br />
2001<br />
2002<br />
2003<br />
2004<br />
2005<br />
Year<br />
2006<br />
2007<br />
2008<br />
2009<br />
2010<br />
No. of depositors<br />
15<br />
10<br />
5<br />
0<br />
2000<br />
2001<br />
2002<br />
2003<br />
2004<br />
Central <strong>Africa</strong> East <strong>Africa</strong> North <strong>Africa</strong><br />
Southern <strong>Africa</strong> West <strong>Africa</strong><br />
2005<br />
Year<br />
2006<br />
2007<br />
2008<br />
2009<br />
2010<br />
Source: MIX Market database 2012, http://www.themix.org/publications/mix-microf<strong>in</strong>ance-world.<br />
Note: All figures provided by MIX Market represent trends because not all MFIs <strong>in</strong> a country report to the database.