Financial Sector Development in Africa: Opportunities ... - World Bank
Financial Sector Development in Africa: Opportunities ... - World Bank
Financial Sector Development in Africa: Opportunities ... - World Bank

You also want an ePaper? Increase the reach of your titles
YUMPU automatically turns print PDFs into web optimized ePapers that Google loves.
Microf<strong>in</strong>ance <strong>in</strong> <strong>Africa</strong> 13<br />
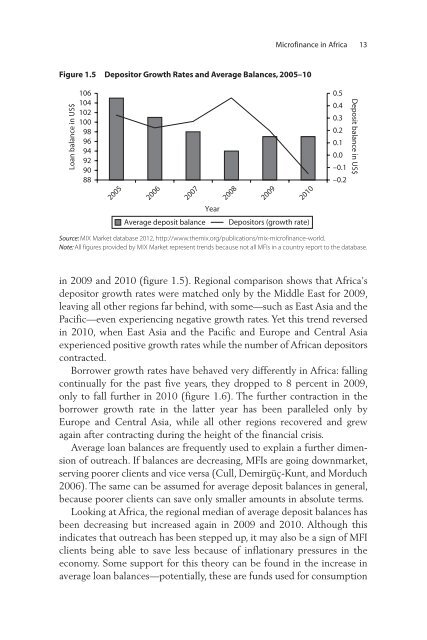
Figure 1.5 Depositor Growth Rates and Average Balances, 2005–10<br />
Loan balance <strong>in</strong> US$<br />
106<br />
104<br />
102<br />
100<br />
98<br />
96<br />
94<br />
92<br />
90<br />
88<br />
2005<br />
2006<br />
2007<br />
2008<br />
2009<br />
2010<br />
0.5<br />
0.4<br />
0.3<br />
0.2<br />
0.1<br />
0.0<br />
–0.1<br />
–0.2<br />
Deposit balance <strong>in</strong> US$<br />
Year<br />
Average deposit balance<br />
Depositors (growth rate)<br />
Source: MIX Market database 2012, http://www.themix.org/publications/mix-microf<strong>in</strong>ance-world.<br />
Note: All figures provided by MIX Market represent trends because not all MFIs <strong>in</strong> a country report to the database.<br />
<strong>in</strong> 2009 and 2010 (figure 1.5). Regional comparison shows that <strong>Africa</strong>’s<br />
depositor growth rates were matched only by the Middle East for 2009,<br />
leav<strong>in</strong>g all other regions far beh<strong>in</strong>d, with some—such as East Asia and the<br />
Pacific—even experienc<strong>in</strong>g negative growth rates. Yet this trend reversed<br />
<strong>in</strong> 2010, when East Asia and the Pacific and Europe and Central Asia<br />
experienced positive growth rates while the number of <strong>Africa</strong>n depositors<br />
contracted.<br />
Borrower growth rates have behaved very differently <strong>in</strong> <strong>Africa</strong>: fall<strong>in</strong>g<br />
cont<strong>in</strong>ually for the past five years, they dropped to 8 percent <strong>in</strong> 2009,<br />
only to fall further <strong>in</strong> 2010 (figure 1.6). The further contraction <strong>in</strong> the<br />
borrower growth rate <strong>in</strong> the latter year has been paralleled only by<br />
Europe and Central Asia, while all other regions recovered and grew<br />
aga<strong>in</strong> after contract<strong>in</strong>g dur<strong>in</strong>g the height of the f<strong>in</strong>ancial crisis.<br />
Average loan balances are frequently used to expla<strong>in</strong> a further dimension<br />
of outreach. If balances are decreas<strong>in</strong>g, MFIs are go<strong>in</strong>g downmarket,<br />
serv<strong>in</strong>g poorer clients and vice versa (Cull, Demirgüç-Kunt, and Morduch<br />
2006). The same can be assumed for average deposit balances <strong>in</strong> general,<br />
because poorer clients can save only smaller amounts <strong>in</strong> absolute terms.<br />
Look<strong>in</strong>g at <strong>Africa</strong>, the regional median of average deposit balances has<br />
been decreas<strong>in</strong>g but <strong>in</strong>creased aga<strong>in</strong> <strong>in</strong> 2009 and 2010. Although this<br />
<strong>in</strong>dicates that outreach has been stepped up, it may also be a sign of MFI<br />
clients be<strong>in</strong>g able to save less because of <strong>in</strong>flationary pressures <strong>in</strong> the<br />
economy. Some support for this theory can be found <strong>in</strong> the <strong>in</strong>crease <strong>in</strong><br />
average loan balances—potentially, these are funds used for consumption