Five Year SummaryInformation for the years 2004, 2005 and 2006 and <strong>2007</strong> is stated under IFRS. Information for the year 2003is stated under UK GAAP based on the 2004 financial statements, without adjustment for any subsequentchanges in UK GAAP which would have applied in 2005, 2006 or <strong>2007</strong>.IFRSUK GAAP<strong>2007</strong> 2006 2005 2004 2003US$m US$m US$m US$m US$mConsolidated Balance SheetConsolidated Balance SheetIntangible assets 207.7 205.3 97.7 93.2 Intangible fixed assets 90.6Property, plant and equipment 2,679.8 2,373.7 1,820.0 1,796.1 Tangible fixed assets 1,863.2Investment property 3.5 3.2 3.4 3.2 Investment in associate –Investment in associate 2.5 3.5 2.8 2.9 Other investments 0.4Trade and other receivables 32.0 39.3 – –Derivative financial instruments 1.4 – – –Available for sale investments 3.3 6.2 0.1 0.1Deferred tax assets 14.7 3.1 6.6 1.6Non-current assets 2,944.9 2,634.3 1,930.6 1,897.1 Fixed assets 1,954.2Current assets 2,910.6 2,450.7 1,849.0 1,302.3 Current assets 451.9Current liabilities (366.6) (513.9) (389.1) (404.5) Current liabilities (308.9)Non-current liabilities (582.4) (623.0) (627.5) (724.9) Long-term liabilities and provisions (848.2)4,906.5 3,948.1 2,763.0 2,070.0 1,249.0Share capital 89.8 89.8 16.6 16.6 Share capitalShare premium 199.2 199.2 272.4 272.4 (including preference shares) 21.0Reserves (retained earnings Share premium 300.4and hedging, translationReserves (profit and loss andand fair value reserves) 3,776.0 2,866.1 1,752.7 1,176.5 revaluation) 584.5Equity attribtutable toShareholders’ fundsequity holders of the Company 4,065.0 3,155.1 2,041.7 1,465.5 (including non-equity interests) 905.9Minority interests 841.5 793.0 721.3 604.5 Minority interests 343.14,906.5 3,948.1 2,763.0 2,070.0 1,249.0IFRSUK GAAP<strong>2007</strong> 2006 2005 2004 2003US$m US$m US$m US$m US$mConsolidated Income StatementConsolidated Profit and Loss AccountGroup turnover 3,826.7 3,870.0 2,445.3 1,942.1 Turnover (1) 978.0Total profit from operationsand associates 2,654.8 2,805.2 1,507.3 1,203.4 Operating profit 387.3Profit before tax 2,750.2 2,859.0 1,536.3 1,198.5 Profit before tax 357.2Income tax expense (638.4) (664.9) (308.1) (241.9) Tax (64.4)Minority interests (729.7) (839.8) (502.4) (377.1) Minority interests (112.1)Net earnings (profit attributable toequity holders of the Company) 1,382.1 1,354.3 725.8 579.5 Profit after tax and minorty interests 180.7EBITDA (2) 2,824.0 2,957.3 1,674.1 1,356.7 EBITDA (2) 524.3IFRSUK GAAP<strong>2007</strong> 2006 2005 2004 2003US cents US cents US cents US cents US centsFURTHER INFORMATIONEarnings per share (3) Earnings per share (3)Basic earnings per share 140.2 137.4 73.6 58.8 Earnings per share 18.3See footnotes on page 142.140<strong>Antofagasta</strong> <strong>plc</strong> <strong>Annual</strong> <strong>Report</strong> and Financial Statements <strong>2007</strong>
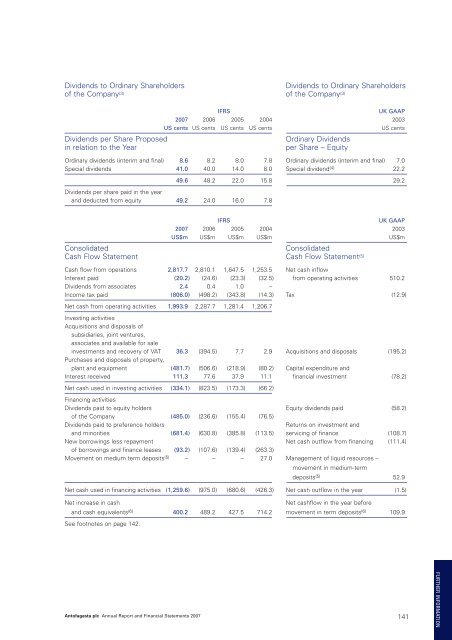
Dividends to Ordinary ShareholdersDividends to Ordinary Shareholdersof the Company (3) of the Company (3)Dividends per Share Proposedin relation to the YearIFRSUK GAAP<strong>2007</strong> 2006 2005 2004 2003US cents US cents US cents US cents US centsOrdinary Dividendsper Share – EquityOrdinary dividends (interim and final) 8.6 8.2 8.0 7.8 Ordinary dividends (interim and final) 7.0Special dividends 41.0 40.0 14.0 8.0 Special dividend (4) 22.2Dividends per share paid in the yearand deducted from equity 49.2 24.0 16.0 7.849.6 48.2 22.0 15.8 29.2IFRSUK GAAP<strong>2007</strong> 2006 2005 2004 2003US$m US$m US$m US$m US$mConsolidatedConsolidatedCash Flow Statement Cash Flow Statement (5)Cash flow from operations 2,817.7 2,810.1 1,647.5 1,253.5 Net cash inflowInterest paid (20.2) (24.6) (23.3) (32.5) from operating activities 510.2Dividends from associates 2.4 0.4 1.0 –Income tax paid (806.0) (498.2) (343.8) (14.3) Tax (12.9)Net cash from operating activities 1,993.9 2,287.7 1,281.4 1,206.7Investing activitiesAcquisitions and disposals ofsubsidiaries, joint ventures,associates and available for saleinvestments and recovery of VAT 36.3 (394.5) 7.7 2.9 Acquisitions and disposals (195.2)Purchases and disposals of property,plant and equipment (481.7) (506.6) (218.9) (80.2) Capital expenditure andInterest received 111.3 77.6 37.9 11.1 financial investment (78.2)Net cash used in investing activities (334.1) (823.5) (173.3) (66.2)Financing activitiesDividends paid to equity holders Equity dividends paid (58.2)of the Company (485.0) (236.6) (155.4) (76.5)Dividends paid to preference holdersReturns on investment andand minorities (681.4) (630.8) (385.8) (113.5) servicing of finance (108.7)New borrowings less repayment Net cash outflow from financing (111.4)of borrowings and finance leases (93.2) (107.6) (139.4) (263.3)Movement on medium term deposits (5) – – – 27.0 Management of liquid resources –movement in medium-termdeposits (5) 52.9Net cash used in financing activities (1,259.6) (975.0) (680.6) (426.3) Net cash outflow in the year (1.5)Net increase in cashNet cashflow in the year beforeand cash equivalents (6) 400.2 489.2 427.5 714.2 movement in term deposits (6) 109.9See footnotes on page 142.<strong>Antofagasta</strong> <strong>plc</strong> <strong>Annual</strong> <strong>Report</strong> and Financial Statements <strong>2007</strong> 141FURTHER INFORMATION