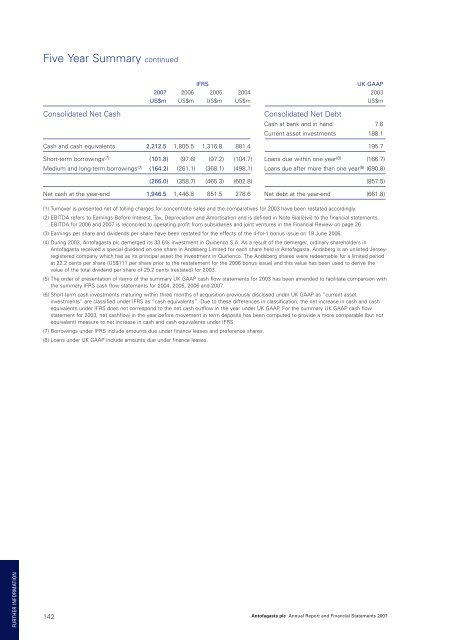
Five Year Summary continuedIFRSUK GAAP<strong>2007</strong> 2006 2005 2004 2003US$m US$m US$m US$m US$mConsolidated Net CashConsolidated Net DebtCash at bank and in hand 7.6Current asset investments 188.1Cash and cash equivalents 2,212.5 1,805.5 1,316.8 881.4 195.7Short-term borrowings (7) (101.8) (97.6) (97.2) (104.7) Loans due within one year (8) (166.7)Medium and long-term borrowings (7) (164.2) (261.1) (368.1) (498.1) Loans due after more than one year (8) (690.8)(266.0) (358.7) (465.3) (602.8) (857.5)Net cash at the year-end 1,946.5 1,446.8 851.5 278.6 Net debt at the year-end (661.8)(1) Turnover is presented net of tolling charges for concentrate sales and the comparatives for 2003 have been restated accordingly.(2) EBITDA refers to Earnings Before Interest, Tax, Depreciation and Amortisation and is defined in Note 5(a)(i)(vii) to the financial statements.EBITDA for 2006 and <strong>2007</strong> is reconciled to operating profit from subsidiaries and joint ventures in the Financial Review on page 26.(3) Earnings per share and dividends per share have been restated for the effects of the 4-for-1 bonus issue on 19 June 2006.(4) During 2003, <strong>Antofagasta</strong> <strong>plc</strong> demerged its 33.6% investment in Quinenco S.A. As a result of the demerger, ordinary shareholders in<strong>Antofagasta</strong> received a special dividend on one share in Andsberg Limited for each share held in <strong>Antofagasta</strong>. Andsberg is an unlisted Jerseyregisteredcompany which has as its principal asset the investment in Quiñenco. The Andsberg shares were redeemable for a limited periodat 22.2 cents per share (US$111 per share prior to the restatement for the 2006 bonus issue) and this value has been used to derive thevalue of the total dividend per share of 29.2 cents (restated) for 2003.(5) The order of presentation of items of the summary UK GAAP cash flow statements for 2003 has been amended to facilitate comparison withthe summary IFRS cash flow statements for 2004, 2005, 2006 and <strong>2007</strong>.(6) Short-term cash investments maturing within three months of acquisition previously disclosed under UK GAAP as “current assetinvestments” are classified under IFRS as “cash equivalents”. Due to these differences in classification, the net increase in cash and cashequivalents under IFRS does not correspond to the net cash outflow in the year under UK GAAP. For the summary UK GAAP cash flowstatement for 2003, net cashflow in the year before movement in term deposits has been computed to provide a more comparable (but notequivalent) measure to net increase in cash and cash equivalents under IFRS.(7) Borrowings under IFRS include amounts due under finance leases and preference shares.(8) Loans under UK GAAP include amounts due under finance leases.FURTHER INFORMATION142<strong>Antofagasta</strong> <strong>plc</strong> <strong>Annual</strong> <strong>Report</strong> and Financial Statements <strong>2007</strong>
Mining Production and Sales, Transport andWater StatisticsFor the year ended 31 December <strong>2007</strong><strong>2007</strong> 2006Q1 Q2 Q3 Q4 Year YearGroup TotalTotal copper production volume (‘000 tonnes) 105.9 106.1 100.6 115.4 428.1 465.5Total copper sales volume (‘000 tonnes) 106.3 107.8 84.6 129.8 428.5 467.8Total molybdenum production volume (‘000 tonnes) 2.1 2.8 2.5 2.7 10.2 9.8Total molybdenum sales volume (‘000 tonnes) 2.2 2.7 2.5 2.6 10.0 9.9Weighted average realised copper price (cents per pound) 297.1 380.2 371.2 277.2 326.6 329.5Realised molybdenum price (dollars per pound) 27.4 33.6 33.5 32.0 31.7 24.6Weighted average cash costs (cents per pound)– excluding by-product credits and tolling charges 76.2 94.0 94.3 97.8 90.6 68.0– excluding by-product credits 93.4 115.3 116.7 117.0 110.7 95.6– net of by-product credits 35.8 24.8 30.1 35.5 31.6 40.2Los Pelambres (60% owned)Daily average ore treated (‘000 tonnes) 125.0 126.0 120.9 133.3 126.3 127.4Average ore grade (%) 0.71 0.70 0.68 0.73 0.71 0.81Average recovery (%) 92.5 91.9 91.1 93.6 92.3 88.7Concentrate produced (‘000 tonnes) 186.5 202.6 208.8 274.3 872.1 842.6Average concentrate grade (%) 39.6 36.5 32.9 30.7 34.5 39.9Fine copper in concentrate (‘000 tonnes) 73.1 73.6 68.9 84.5 300.1 335.2Payable copper in concentrate – production volume (‘000 tonnes) 70.7 71.1 66.6 81.6 289.9 324.2Payable copper in concentrate – sales volume (‘000 tonnes) 71.9 71.3 49.7 96.5 289.4 324.8Average moly ore grade (%) 0.033 0.030 0.027 0.030 0.030 0.028Average moly recovery (%) 66.7 75.6 78.7 76.8 74.2 76.1Payable moly in concentrate – production volume (‘000 tonnes) 2.1 2.8 2.5 2.7 10.2 9.8Payable moly in concentrate – sales volume (‘000 tonnes) 2.2 2.7 2.5 2.6 10.0 9.9Realised copper price (cents per pound) 304.8 392.6 387.2 267.9 328.3 335.0On-site and shipment costs (cents per pound) 64.7 82.0 77.3 80.6 76.3 56.4Tolling charges for concentrates (cents per pound) 25.7 31.9 33.8 27.3 29.6 39.7Cash costs (before by-product) (cents per pound) 90.4 113.9 111.1 107.9 105.9 96.1By-product credits (cents per pound) (86.3) (135.2) (130.8) (115.4) (116.7) (79.7)Cash costs (cents per pound) 4.2 (21.3) (19.6) (7.5) (10.8) 16.4El Tesoro (100% owned; 61% until 24 August 2006)Daily average ore treated (‘000 tonnes) 27.8 26.3 24.7 28.5 26.8 28.7Average ore grade (%) 1.21 1.25 1.27 1.19 1.23 1.16Average recovery (%) 77.4 77.3 79.4 77.0 77.8 78.1Copper cathodes – production volume (‘000 tonnes) 23.6 23.2 22.5 23.7 93.0 94.0Copper cathodes – sales volume (‘000 tonnes) 22.2 24.6 23.8 22.7 93.3 95.3Realised copper price (cents per pound) 278.9 360.5 358.7 307.1 327.6 316.4Cash costs (cents per pound) 87.4 106.5 116.9 128.6 109.8 78.6Michilla (74.2% owned)Daily average ore treated (‘000 tonnes) 15.2 15.4 15.1 13.7 14.8 15.2Average ore grade (%) 1.04 1.04 1.04 1.00 1.03 1.05Average recovery (%) 81.2 78.3 78.3 78.5 79.1 78.2Copper cathodes – production volume (‘000 tonnes) 11.6 11.8 11.4 10.2 45.1 47.3Copper cathodes – sales volume (‘000 tonnes) 12.2 11.9 11.1 10.6 45.8 47.7Realised copper price (cents per pound) 284.8 346.5 326.5 297.0 313.8 318.5Cash costs (cents per pound) 123.1 141.4 148.8 163.4 143.5 126.4Transport (100% owned)Rail tonnage transported (‘000 tons) 1,253 1,301 1,195 1,259 5,008 4,486Road tonnage transported (‘000 tons) 321 342 340 309 1,313 1,456Water (100% owned)Water volume sold – potable and untreated (‘000m 3 ) 10,069 9,740 9,679 10,369 39,858 37,798Notesa) The production figures represent the total amounts produced for each mine, not the Group’s attributable share for each mine.b) Los Pelambres produces copper and molybdenum concentrates, and the figures for Los Pelambres are expressed in terms of payable metal contained in concentrate.The copper concentrate also contains gold and silver, for which Los Pelambres is credited when the concentrate is sold. El Tesoro and Michilla produce coppercathodes with no by-products.c) Cash costs are a measure of the cost of operational production expressed in terms of cents per pound of payable copper produced. Cash costs are stated net ofby-product credits and include tolling charges for concentrate for Los Pelambres. Cash costs exclude depreciation, financial income and expenses, hedging gains andlosses, exchange gains and losses and corporation tax for all three operations. By-product calculations do not take into account unrealised mark-to-market gains formolybdenum at the beginning or end of each period.d) Water volumes include water transportation of 300,000 m 3 in Q1, 266,000 m 3 in Q2, 348,000 m 3 in Q3 and 343,000 m 3 in Q4, totalling 1,258,000 m 3 for <strong>2007</strong>(2006 – 1,604,000 m 3 ).d) The Q4 <strong>2007</strong> water volumes include 77,000 m 3 of water supplied during the first nine months of <strong>2007</strong> but not originally recorded within those periods.e) The totals in the table may include some small apparent differences as the specific individual figures have not been rounded.<strong>Antofagasta</strong> <strong>plc</strong> <strong>Annual</strong> <strong>Report</strong> and Financial Statements <strong>2007</strong> 143FURTHER INFORMATION