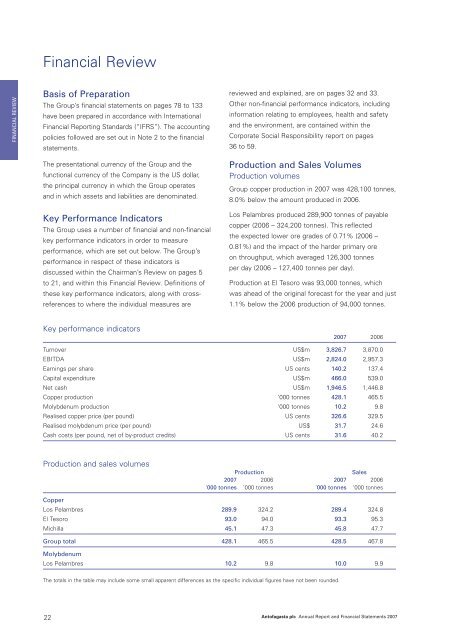
Financial ReviewFINANCIAL REVIEWBasis of PreparationThe Group’s financial statements on pages 78 to 133have been prepared in accordance with InternationalFinancial <strong>Report</strong>ing Standards (“IFRS”). The accountingpolicies followed are set out in Note 2 to the financialstatements.The presentational currency of the Group and thefunctional currency of the Company is the US dollar,the principal currency in which the Group operatesand in which assets and liabilities are denominated.Key Performance IndicatorsThe Group uses a number of financial and non-financialkey performance indicators in order to measureperformance, which are set out below. The Group’sperformance in respect of these indicators isdiscussed within the Chairman’s Review on pages 5to 21, and within this Financial Review. Definitions ofthese key performance indicators, along with crossreferencesto where the individual measures arereviewed and explained, are on pages 32 and 33.Other non-financial performance indicators, includinginformation relating to employees, health and safetyand the environment, are contained within theCorporate Social Responsibility report on pages36 to 59.Production and Sales VolumesProduction volumesGroup copper production in <strong>2007</strong> was 428,100 tonnes,8.0% below the amount produced in 2006.Los Pelambres produced 289,900 tonnes of payablecopper (2006 – 324,200 tonnes). This reflectedthe expected lower ore grades of 0.71% (2006 –0.81%) and the impact of the harder primary oreon throughput, which averaged 126,300 tonnesper day (2006 – 127,400 tonnes per day).Production at El Tesoro was 93,000 tonnes, whichwas ahead of the original forecast for the year and just1.1% below the 2006 production of 94,000 tonnes.Key performance indicators<strong>2007</strong> 2006Turnover US$m 3,826.7 3,870.0EBITDA US$m 2,824.0 2,957.3Earnings per share US cents 140.2 137.4Capital expenditure US$m 466.0 539.0Net cash US$m 1,946.5 1,446.8Copper production ‘000 tonnes 428.1 465.5Molybdenum production ‘000 tonnes 10.2 9.8Realised copper price (per pound) US cents 326.6 329.5Realised molybdenum price (per pound) US$ 31.7 24.6Cash costs (per pound, net of by-product credits) US cents 31.6 40.2Production and sales volumesProductionSales<strong>2007</strong> 2006 <strong>2007</strong> 2006’000 tonnes ’000 tonnes ’000 tonnes ’000 tonnesCopperLos Pelambres 289.9 324.2 289.4 324.8El Tesoro 93.0 94.0 93.3 95.3Michilla 45.1 47.3 45.8 47.7Group total 428.1 465.5 428.5 467.8MolybdenumLos Pelambres 10.2 9.8 10.0 9.9The totals in the table may include some small apparent differences as the specific individual figures have not been rounded.22<strong>Antofagasta</strong> <strong>plc</strong> <strong>Annual</strong> <strong>Report</strong> and Financial Statements <strong>2007</strong>
The lower plant throughput in the year of 26,800tonnes per day (2006 – 28,700 tonnes per day) whichwas due to high moisture levels in the ore processed,was largely offset by the higher ore grades of 1.23%(2006 – 1.16%).Michilla’s production in <strong>2007</strong> was 45,100 tonnes,a 4.7% decrease over the 2006 production level of47,300 tonnes, although only slightly below the originalforecast for the year. The earthquake which occurredin northern Chile on 14 November <strong>2007</strong> resulted insome disruption during the final part of the year, whichreduced throughput and the grade of ore processed.During the year average throughput was 14,800tonnes per day compared with 15,200 tonnes perday in 2006, and ore grades declined to 1.03%(2006 – 1.05%).Molybdenum production at Los Pelambres reached10,200 tonnes, a 4.1% increase compared with the9,800 tonnes produced in 2006, mainly due to theimproved grades of 0.030% (2006 – 0.028%).Further details of throughput, grade and recoveriesat each mine are given in the Mining Production andSales, Transport and Water Statistics on page 143.Sales volumesThe volume of copper sold decreased by 8.4% from467,800 tonnes in 2006 to 428,500 tonnes this year.Molybdenum sales volumes were largely unchangedat 10,000 tonnes (2006 – 9,900 tonnes). Sales volumesfor both copper and molybdenum differed slightly fromproduction each year mainly due to differences inshipping and loading schedules.Transport and water volumesRail and road transport volumes at the transportdivision in <strong>2007</strong> were 5.0 million tons (2006 –4.5 million tons) and 1.3 million tons (2006 – 1.5 milliontons) respectively. Rail tonnages transported in <strong>2007</strong>increased by 11.6% over 2006 due to increases fromvarious mines. The most significant of these wasBHP Billiton’s Spence mine where the combinedvolumes of sulphuric acid and copper cathodescontributed an additional 0.3 million tons.At Aguas de <strong>Antofagasta</strong> the volume of water soldin 2006 increased by 5.5% from 37.8 million cubicmetres to 39.9 million cubic metres this year, as aresult of higher volumes to industrial customers,mainly due to the full-year impact of Spence whichstarted its operations during the second half of 2006.Realised Prices per Pound ofCopper and Molybdenum Sold andCash Costs per Pound of CopperProducedRealised pricesThe Group’s average realised copper price decreasedby 0.9% to US 326.6 cents per pound (2006 –US 329.5 cents per pound), despite a 5.9% increasein the average LME copper price to US 323.3 centsper pound (2006 – US 305.3 cents per pound).Realised copper prices are determined by comparingturnover (gross of tolling charges for concentrate sales)with sales volumes in the period. Realised copperprices differ from market prices mainly because, in linewith industry practice, concentrate and cathode salesagreements generally provide for provisional pricingat the time of shipment with final pricing based on theaverage market price for future periods (normally about30 days after delivery to the customer in the case ofcathode sales and up to 180 days after delivery to thecustomer in the case of concentrate sales). In <strong>2007</strong>the pricing adjustments on provisionally invoiced sales,while remaining positive, were lower than in 2006,as the level of increase in the LME copper price inthe current year was less than in 2006.In the case of Los Pelambres, pricing adjustmentsadded US$52.8 million in <strong>2007</strong> to initially invoicedsales (before adjusting for tolling charges) comparedwith US$223.5 million in 2006. The adjustments in<strong>2007</strong> comprised US$22.0 million in respect of salesinvoiced in 2006 (net of the reversal of mark-to-marketadjustments made at the end of 2006) which werefinally priced in <strong>2007</strong> and US$30.8 million in respectof sales invoiced in <strong>2007</strong> (net of a mark-to-marketprovision for open sales at the end of the year ofUS$72.8 million). Pricing adjustments in <strong>2007</strong> atEl Tesoro and Michilla reduced revenues by US$5.1million (2006 – increased revenues by US$11.7 million)and US$1.2 million (2006 – increased revenues byUS$8.9 million) respectively. El Tesoro and Michillacontinued to benefit from strong cathode premiumsreflecting tight market conditions in the year.FINANCIAL REVIEW<strong>Antofagasta</strong> <strong>plc</strong> <strong>Annual</strong> <strong>Report</strong> and Financial Statements <strong>2007</strong> 23