Annual Report 2007 - Antofagasta plc
Annual Report 2007 - Antofagasta plc
Annual Report 2007 - Antofagasta plc

Create successful ePaper yourself
Turn your PDF publications into a flip-book with our unique Google optimized e-Paper software.
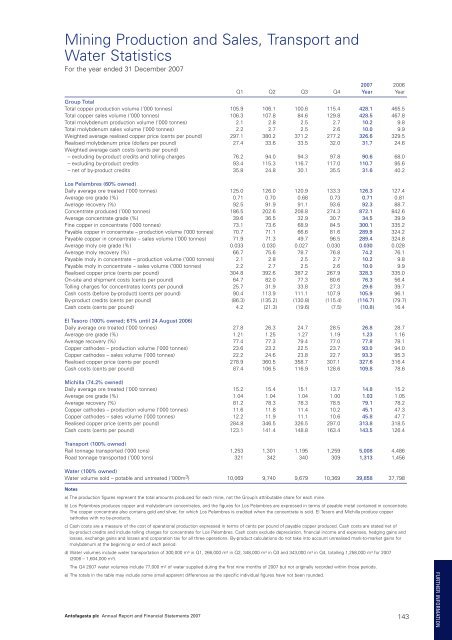
Mining Production and Sales, Transport andWater StatisticsFor the year ended 31 December <strong>2007</strong><strong>2007</strong> 2006Q1 Q2 Q3 Q4 Year YearGroup TotalTotal copper production volume (‘000 tonnes) 105.9 106.1 100.6 115.4 428.1 465.5Total copper sales volume (‘000 tonnes) 106.3 107.8 84.6 129.8 428.5 467.8Total molybdenum production volume (‘000 tonnes) 2.1 2.8 2.5 2.7 10.2 9.8Total molybdenum sales volume (‘000 tonnes) 2.2 2.7 2.5 2.6 10.0 9.9Weighted average realised copper price (cents per pound) 297.1 380.2 371.2 277.2 326.6 329.5Realised molybdenum price (dollars per pound) 27.4 33.6 33.5 32.0 31.7 24.6Weighted average cash costs (cents per pound)– excluding by-product credits and tolling charges 76.2 94.0 94.3 97.8 90.6 68.0– excluding by-product credits 93.4 115.3 116.7 117.0 110.7 95.6– net of by-product credits 35.8 24.8 30.1 35.5 31.6 40.2Los Pelambres (60% owned)Daily average ore treated (‘000 tonnes) 125.0 126.0 120.9 133.3 126.3 127.4Average ore grade (%) 0.71 0.70 0.68 0.73 0.71 0.81Average recovery (%) 92.5 91.9 91.1 93.6 92.3 88.7Concentrate produced (‘000 tonnes) 186.5 202.6 208.8 274.3 872.1 842.6Average concentrate grade (%) 39.6 36.5 32.9 30.7 34.5 39.9Fine copper in concentrate (‘000 tonnes) 73.1 73.6 68.9 84.5 300.1 335.2Payable copper in concentrate – production volume (‘000 tonnes) 70.7 71.1 66.6 81.6 289.9 324.2Payable copper in concentrate – sales volume (‘000 tonnes) 71.9 71.3 49.7 96.5 289.4 324.8Average moly ore grade (%) 0.033 0.030 0.027 0.030 0.030 0.028Average moly recovery (%) 66.7 75.6 78.7 76.8 74.2 76.1Payable moly in concentrate – production volume (‘000 tonnes) 2.1 2.8 2.5 2.7 10.2 9.8Payable moly in concentrate – sales volume (‘000 tonnes) 2.2 2.7 2.5 2.6 10.0 9.9Realised copper price (cents per pound) 304.8 392.6 387.2 267.9 328.3 335.0On-site and shipment costs (cents per pound) 64.7 82.0 77.3 80.6 76.3 56.4Tolling charges for concentrates (cents per pound) 25.7 31.9 33.8 27.3 29.6 39.7Cash costs (before by-product) (cents per pound) 90.4 113.9 111.1 107.9 105.9 96.1By-product credits (cents per pound) (86.3) (135.2) (130.8) (115.4) (116.7) (79.7)Cash costs (cents per pound) 4.2 (21.3) (19.6) (7.5) (10.8) 16.4El Tesoro (100% owned; 61% until 24 August 2006)Daily average ore treated (‘000 tonnes) 27.8 26.3 24.7 28.5 26.8 28.7Average ore grade (%) 1.21 1.25 1.27 1.19 1.23 1.16Average recovery (%) 77.4 77.3 79.4 77.0 77.8 78.1Copper cathodes – production volume (‘000 tonnes) 23.6 23.2 22.5 23.7 93.0 94.0Copper cathodes – sales volume (‘000 tonnes) 22.2 24.6 23.8 22.7 93.3 95.3Realised copper price (cents per pound) 278.9 360.5 358.7 307.1 327.6 316.4Cash costs (cents per pound) 87.4 106.5 116.9 128.6 109.8 78.6Michilla (74.2% owned)Daily average ore treated (‘000 tonnes) 15.2 15.4 15.1 13.7 14.8 15.2Average ore grade (%) 1.04 1.04 1.04 1.00 1.03 1.05Average recovery (%) 81.2 78.3 78.3 78.5 79.1 78.2Copper cathodes – production volume (‘000 tonnes) 11.6 11.8 11.4 10.2 45.1 47.3Copper cathodes – sales volume (‘000 tonnes) 12.2 11.9 11.1 10.6 45.8 47.7Realised copper price (cents per pound) 284.8 346.5 326.5 297.0 313.8 318.5Cash costs (cents per pound) 123.1 141.4 148.8 163.4 143.5 126.4Transport (100% owned)Rail tonnage transported (‘000 tons) 1,253 1,301 1,195 1,259 5,008 4,486Road tonnage transported (‘000 tons) 321 342 340 309 1,313 1,456Water (100% owned)Water volume sold – potable and untreated (‘000m 3 ) 10,069 9,740 9,679 10,369 39,858 37,798Notesa) The production figures represent the total amounts produced for each mine, not the Group’s attributable share for each mine.b) Los Pelambres produces copper and molybdenum concentrates, and the figures for Los Pelambres are expressed in terms of payable metal contained in concentrate.The copper concentrate also contains gold and silver, for which Los Pelambres is credited when the concentrate is sold. El Tesoro and Michilla produce coppercathodes with no by-products.c) Cash costs are a measure of the cost of operational production expressed in terms of cents per pound of payable copper produced. Cash costs are stated net ofby-product credits and include tolling charges for concentrate for Los Pelambres. Cash costs exclude depreciation, financial income and expenses, hedging gains andlosses, exchange gains and losses and corporation tax for all three operations. By-product calculations do not take into account unrealised mark-to-market gains formolybdenum at the beginning or end of each period.d) Water volumes include water transportation of 300,000 m 3 in Q1, 266,000 m 3 in Q2, 348,000 m 3 in Q3 and 343,000 m 3 in Q4, totalling 1,258,000 m 3 for <strong>2007</strong>(2006 – 1,604,000 m 3 ).d) The Q4 <strong>2007</strong> water volumes include 77,000 m 3 of water supplied during the first nine months of <strong>2007</strong> but not originally recorded within those periods.e) The totals in the table may include some small apparent differences as the specific individual figures have not been rounded.<strong>Antofagasta</strong> <strong>plc</strong> <strong>Annual</strong> <strong>Report</strong> and Financial Statements <strong>2007</strong> 143FURTHER INFORMATION