

An Unhealthy America: The Economic Burden of ... - Milken Institute
An Unhealthy America: The Economic Burden of ... - Milken Institute
An Unhealthy America: The Economic Burden of ... - Milken Institute

You also want an ePaper? Increase the reach of your titles
YUMPU automatically turns print PDFs into web optimized ePapers that Google loves.
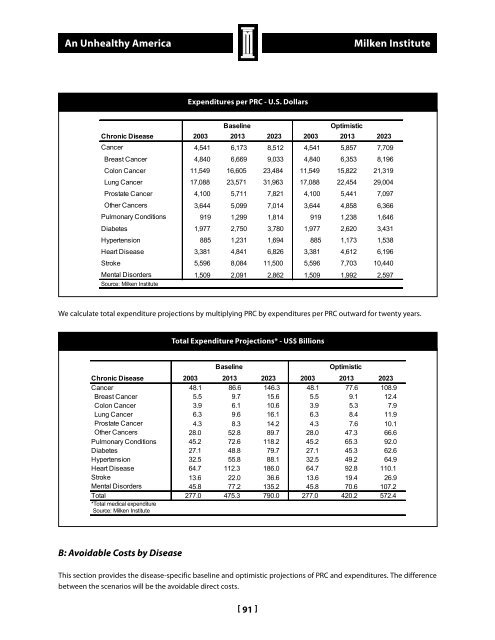
<strong>An</strong> <strong>Unhealthy</strong> <strong>America</strong><strong>Milken</strong> <strong>Institute</strong>Expenditures Baseline PRC* Expenditures/PRCOptimisticChronic Disease 2003 (Billions) 2013 2023 (Millions) 2003 (Thousands) 2013 2023Cancer Cancer 4,541 6,173 48.1 8,512 10.6 4,541 5,857 4.5 7,709Breast Cancer 5.5 1.1 4.8Breast Cancer 4,840 6,669 9,033 4,840 6,353 8,196Colon Cancer 3.9 0.3 11.5ColonLungCancerCancer11,549 16,6056.323,4840.411,549 15,82217.121,319Lung Cancer Prostate Cancer 17,088 23,571 4.3 31,9631.0 17,088 22,454 4.1 29,004Prostate Other Cancer Cancers 4,100 5,711 28.0 7,8217.7 4,100 5,441 3.6 7,097Other Pulmonary Cancers Conditions3,644 5,09945.27,01449.23,644 4,8580.96,366Diabetes 27.1 13.7 2.0Pulmonary Conditions 919 1,299 1,814 919 1,238 1,646Hypertension 32.5 36.8 0.9Diabetes Heart Disease 1,977 2,750 64.7 3,780 19.2 1,977 2,620 3.4 3,431Hypertension Stroke 885 1,231 13.6 1,6942.4 885 1,173 5.6 1,538Heart Disease Mental Disorders 3,381 4,841 45.8 6,826 30.3 3,381 4,612 1.5 6,196TotalStroke 5,596277.08,084162.211,500 5,5961.77,703 10,440PRC: Population Reporting ConditionMental Disorders 1,509 2,091 2,862 1,509 1,992 2,597Source: <strong>Milken</strong> <strong>Institute</strong>ExpendituresExpendituresper PRCper- U.S.PRCDollarsWe calculate total expenditure projections by multiplying PRC by expenditures per PRC outward for twenty years.TotalTotalExpenditureExpenditureProjections*Projections*- US$ BillionsUS$ BillionsExpendituresBaseline PRC* Expenditures/PRCOptimisticDisease(Billions) (Millions) (Thousands)Chronic Disease 2003 2013 2023 2003 2013 2023Cancer 48.1 10.6 4.5Cancer 48.1 86.6 146.3 48.1 77.6 108.9Breast Cancer Breast Cancer 5.5 9.7 5.5 15.6 1.1 5.5 4.89.1 12.4Colon Cancer Colon Cancer 3.9 6.1 3.9 10.6 0.3 3.9 11.55.3 7.9Lung Cancer Lung Cancer 6.3 9.6 6.3 16.1 0.4 6.3 17.18.4 11.9Prostate Cancer Prostate Cancer 4.3 8.3 4.3 14.2 1.0 4.3 4.17.6 10.1Other Cancers Other Cancers 28.0 52.8 28.0 89.7 7.7 28.0 3.6 47.3 66.6Pulmonary Pulmonary Conditions Conditions45.2 72.6 45.2 118.249.2 45.2 0.9 65.3 92.0Diabetes Diabetes 27.1 48.8 27.1 79.713.7 27.1 2.0 45.3 62.6Hypertension Hypertension 32.5 55.8 32.5 88.136.8 32.5 0.9 49.2 64.9Heart Disease Heart Disease 64.7 112.3 64.7 186.019.2 64.7 3.4 92.8 110.1Stroke Stroke 13.6 22.0 13.6 36.6 2.4 13.6 5.6 19.4 26.9Mental Disorders Mental Disorders 45.8 77.2 45.8 135.230.3 45.8 1.5 70.6 107.2Total Total 277.0 475.3 277.0 790.0 162.2 277.0 420.2 1.7 572.4*Total medical expenditureSource: <strong>Milken</strong> PRC: <strong>Institute</strong> Population Reporting ConditionB: Avoidable Costs by DiseaseThis section provides the disease-specific baseline and optimistic projections <strong>of</strong> PRC and expenditures. <strong>The</strong> differencebetween the scenarios will be the avoidable direct costs.[ 91 ]


