<strong>An</strong> <strong>Unhealthy</strong> <strong>America</strong><strong>Milken</strong> <strong>Institute</strong>OregonOregonDirect Costs2003 2023Projections - Level Projections - DifferenceAvoidable Costs(US$ Billions)Expenditure perPRC ($)Total Expenditure(US$ Billions) PRC (Thousands)PRC (Thousands) Expenditure per PRC ($)Baseline Optimistic Baseline Optimistic Baseline Optimistic Absolute Percent Absolute Percent Absolute PercentTotal Expenditure(US$ Billions)Expenditure per PRC($)PRC(Thousands)Chronic DiseaseDiseaseExpenditures(Billions)PRC*(Millions)Cancer 48.1 10.6 4.5Breast Cancer 5.5 1.1 4.8Colon Cancer 3.9 0.3 11.5Lung Cancer 6.3 0.4 17.1Prostate Cancer 4.3 1.0 4.1Other Cancers 28.0 7.7 3.6Pulmonary Conditions 45.2 49.2 0.9Diabetes 27.1 13.7 2.0Hypertension 32.5 36.8 0.9Heart Disease 64.7 19.2 3.4Cancer 123 4,160 0.51 203 167 8,558 7,664 1.74 1.28 -36 -17.80 -893 -10.44 -0.46 -26.38Breast cancer 13 4,667 0.06 19 17 9,539 8,536 0.18 0.14 -2 -12.30 -1,003 -10.52 -0.04 -21.52Colon cancer 4 10,916 0.05 6 5 24,613 22,036 0.14 0.11 -1 -17.67 -2,577 -10.47 -0.04 -26.29Lung cancer 5 16,127 0.09 7 6 33,053 29,577 0.24 0.18 -1 -18.44 -3,476 -10.52 -0.07 -27.02Prostate cancer 10 3,785 0.04 19 15 7,932 7,099 0.15 0.11 -4 -21.48 -833 -10.51 -0.05 -29.73Other cancers 90 3,157 0.28 151 124 6,686 5,984 1.01 0.74 -27 -18.00 -702 -10.50 -0.27 -26.61Diabetes 138 1,870 0.26 222 192 3,930 3,517 0.87 0.68 -29 -13.30 -413 -10.50 -0.20 -22.40Heart disease 190 3,236 0.62 274 179 7,237 6,479 1.98 1.16 -95 -34.63 -758 -10.47 -0.82 -41.47Pulmonary conditions 590 825 0.49 809 695 1,798 1,609 1.45 1.12 -114 -14.05 -189 -10.49 -0.34 -23.07Hypertension 377 839 0.32 533 434 1,766 1,580 0.94 0.69 -100 -18.70 -185 -10.50 -0.26 -27.24Stroke 35 5,394 0.19 48 39 12,309 11,021 0.59 0.43 -9 -18.84 -1,288 -10.46 -0.16 -27.33Mental disorders 627 1,674 1.06 1,001 878 3,486 3,119 3.49 2.74 -124 -12.35 -366 -10.51 -0.75 -21.56Total 2,080 1,653 3.44 3,090 2,583 4,038 3,614 11.06 8.08 -506 -16.39 -423 -10.49 -2.98 -26.94Indirect Impacts* (US$ Billions)2023Individual Caregiver TotalLost Work Days Presenteeism Lost Work Days Presenteeism Projections - Level Projections - DifferenceBaseline Optimistic Baseline Optimistic Baseline Optimistic Baseline Optimistic Baseline Optimistic Absolute Percent2003TotalLevelChronic DiseaseCancer 3.14 0.58 0.47 9.77 5.81 0.042 0.034 0.94 0.61 11.33 6.93 -4.40 -38.87Breast cancer 0.36 0.06 0.05 1.03 0.66 0.004 0.004 0.10 0.07 1.20 0.78 -0.42 -34.84Colon cancer 0.29 0.05 0.04 0.81 0.48 0.003 0.003 0.08 0.05 0.94 0.58 -0.37 -38.79Lung cancer 0.52 0.08 0.07 1.38 0.81 0.006 0.005 0.13 0.09 1.60 0.97 -0.63 -39.40Prostate cancer 0.24 0.05 0.04 0.86 0.49 0.004 0.003 0.08 0.05 1.00 0.58 -0.42 -41.65Other cancers 1.73 0.34 0.27 5.68 3.37 0.024 0.020 0.55 0.36 6.59 4.01 -2.57 -39.07Diabetes 1.06 0.37 0.32 2.98 2.34 0.029 0.025 0.32 0.25 3.69 2.93 -0.77 -20.76Heart disease 1.04 0.64 0.42 2.31 1.26 0.062 0.041 0.22 0.12 3.24 1.84 -1.39 -43.01Asthma 1.12 0.67 0.57 2.38 1.93 0.048 0.042 0.23 0.19 3.32 2.73 -0.59 -17.74Hypertension 2.87 1.29 1.05 6.68 5.29 0.126 0.103 0.65 0.51 8.75 6.95 -1.80 -20.55Stroke 0.32 0.16 0.13 0.70 0.53 0.012 0.009 0.07 0.05 0.94 0.72 -0.22 -23.35Emotional disturbances 3.53 1.35 1.18 9.81 8.24 0.098 0.086 0.94 0.79 12.20 10.30 -1.89 -15.54Total 13.08 5.04 4.14 34.63 25.40 0.42 0.34 3.37 2.53 43.46 32.40 -11.06 -25.45* Based on Nominal GDPExpenditures/PRC(Thousands)Intergenerational Impacts2023 2023 2050 2050Projections - LevelProjections - Difference Projections - Level Projections - DifferenceStroke 13.6 2.4 5.6Mental Disorders 45.8 30.3 1.5Total 277.0 162.2 1.7PRC: Population Reporting ConditionPercentBaseline Optimistic Absolute Percent Baseline Optimistic Absolute1970 2003VariablesBachelor's degrees (percent) 11.80 26.90 30.34 32.31 1.97 6.51 37.98 44.59 6.61 17.40Capital stock (US$ Billions) 67.00 192.64 410.48 425.45 14.96 3.64 1485.73 1630.58 144.85 9.72Life expectancy at 65 (years) 15.57 18.59 20.33 21.50 1.17 5.76 23.24 25.49 2.25 9.66GDP* by state (US$ Billions) 15.22 125.11 170.17 182.18 12.01 7.06 356.51 419.33 62.82 17.62*Based on Real GDP[ 223 ]
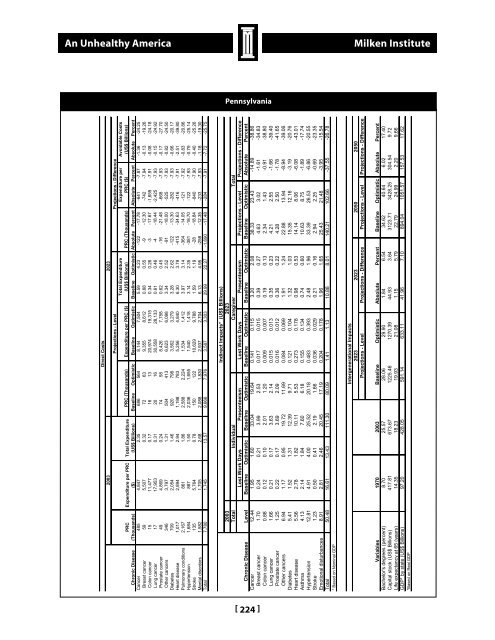
<strong>An</strong> <strong>Unhealthy</strong> <strong>America</strong><strong>Milken</strong> <strong>Institute</strong>PennsylvaniaPennsylvaniaDirect Costs2003 2023Projections - Level Projections - DifferenceAvoidable Costs(US$ Billions)Expenditure perPRC ($)Total Expenditure(US$ Billions) PRC (Thousands)PRC (Thousands) Expenditure per PRC ($)Baseline Optimistic Baseline Optimistic Baseline Optimistic Absolute Percent Absolute Percent Absolute PercentTotal Expenditure(US$ Billions)Expenditure per PRC($)PRC(Thousands)Chronic DiseaseDiseaseExpenditures(Billions)PRC*(Millions)Cancer 48.1 10.6 4.5Breast Cancer 5.5 1.1 4.8Colon Cancer 3.9 0.3 11.5Lung Cancer 6.3 0.4 17.1Prostate Cancer 4.3 1.0 4.1Other Cancers 28.0 7.7 3.6Pulmonary Conditions 45.2 49.2 0.9Diabetes 27.1 13.7 2.0Hypertension 32.5 36.8 0.9Cancer 485 4,847 2.35 686 564 8,144 7,504 5.59 4.23 -122 -17.78 -641 -7.87 -1.36 -24.25Breast cancer 59 5,507 0.32 72 63 9,355 8,612 0.68 0.55 -9 -12.30 -742 -7.94 -0.13 -19.26Colon cancer 15 11,477 0.17 16 13 20,974 19,315 0.34 0.26 -3 -17.67 -1,659 -7.91 -0.08 -24.18Lung cancer 17 17,953 0.31 20 16 30,558 28,133 0.61 0.46 -4 -18.44 -2,425 -7.93 -0.15 -24.92Prostate cancer 49 4,869 0.24 74 58 8,426 7,758 0.62 0.45 -16 -21.48 -668 -7.93 -0.17 -27.70Other cancers 346 3,797 1.31 504 413 6,623 6,098 3.34 2.52 -91 -18.00 -525 -7.93 -0.82 -24.50Diabetes 709 2,054 1.46 920 798 3,562 3,279 3.28 2.62 -122 -13.30 -282 -7.93 -0.66 -20.17Heart disease 1,017 2,894 2.94 1,198 783 5,256 4,840 6.30 3.79 -415 -34.63 -416 -7.91 -2.51 -39.80Pulmonary conditions 2,167 861 1.86 2,588 2,224 1,534 1,412 3.97 3.14 -364 -14.05 -121 -7.92 -0.83 -20.86Hypertension 1,684 887 1.50 2,036 1,655 1,540 1,418 3.14 2.35 -381 -18.70 -122 -7.93 -0.79 -25.14Stroke 135 5,764 0.78 150 122 10,629 9,788 1.59 1.19 -28 -18.84 -840 -7.90 -0.40 -25.26Mental disorders 1,582 1,705 2.68 2,088 1,830 2,937 2,704 6.13 4.95 -258 -12.35 -233 -7.93 -1.18 -19.30Total 7,780 1,745 13.57 9,666 7,976 3,587 3,303 29.99 22.27 -1,690 -17.48 -284 -7.91 -7.72 -25.75Indirect Impacts* (US$ Billions)2023Individual Caregiver Total2003TotalLost Work Days Presenteeism Lost Work Days Presenteeism Projections - Level Projections - DifferenceBaseline Optimistic Baseline Optimistic Baseline Optimistic Baseline Optimistic Baseline Optimistic Absolute PercentLevelChronic DiseaseCancer 12.44 1.95 1.60 33.04 19.64 0.141 0.115 3.20 2.08 38.33 23.43 -14.89 -38.86Breast cancer 1.70 0.24 0.21 3.99 2.53 0.017 0.015 0.39 0.27 4.63 3.02 -1.61 -34.83Colon cancer 0.88 0.12 0.10 2.01 1.20 0.009 0.007 0.19 0.13 2.34 1.43 -0.91 -38.80Lung cancer 1.66 0.21 0.17 3.63 2.14 0.015 0.013 0.35 0.23 4.21 2.55 -1.66 -39.40Prostate cancer 1.25 0.22 0.17 3.69 2.09 0.016 0.012 0.36 0.22 4.28 2.50 -1.78 -41.65Other cancers 6.94 1.17 0.95 19.72 11.69 0.084 0.069 1.91 1.24 22.88 13.94 -8.94 -39.06Diabetes 5.41 1.52 1.31 12.39 9.71 0.121 0.104 1.32 1.03 15.35 12.16 -3.19 -20.76Heart disease 5.56 2.78 1.82 10.11 5.53 0.273 0.178 0.98 0.53 14.14 8.06 -6.08 -43.01Asthma 4.13 2.14 1.84 7.60 6.18 0.155 0.134 0.74 0.60 10.63 8.75 -1.89 -17.74Hypertension 12.81 4.91 4.00 25.52 20.18 0.483 0.393 2.48 1.96 33.39 26.53 -6.86 -20.55Stroke 1.23 0.50 0.41 2.19 1.66 0.036 0.029 0.21 0.16 2.94 2.25 -0.69 -23.35Emotional disturbances 8.91 2.81 2.46 20.45 17.19 0.204 0.178 1.96 1.65 25.43 21.48 -3.95 -15.54Total 50.48 16.61 13.43 111.30 80.09 1.41 1.13 10.88 8.01 140.21 102.66 -37.55 -26.78* Based on Nominal GDPExpenditures/PRC(Thousands)Intergenerational Impacts2023 2023 2050 2050Projections - Level Projections - Difference Projections - Level Projections - DifferenceHeart Disease 64.7 19.2 3.4Stroke 13.6 2.4 5.6Mental Disorders 45.8 30.3 1.5Total 277.0 162.2 1.7PRC: Population Reporting ConditionBaseline Optimistic Absolute PercentBaseline Optimistic Absolute Percent1970 2003VariablesBachelor's degrees (percent) 8.70 25.57 28.06 29.90 1.84 6.54 34.62 40.64 6.02 17.40Capital stock (US$ Billions) 417.81 673.67 1225.46 1270.39 44.93 3.64 3123.71 3428.25 304.54 9.72Life expectancy at 65 (years) 14.35 18.23 19.93 21.08 1.15 5.79 22.79 24.99 2.20 9.66GDP* by state (US$ Billions) 97.20 428.05 591.14 633.11 41.96 7.10 894.04 1051.57 157.53 17.62*Based on Real GDP[ 224 ]
- Page 8:
An Unhealthy AmericaMilken Institut
- Page 11 and 12:
iitime of the analysis show that th
- Page 13 and 14:
Existing estimates of the economic
- Page 16 and 17:
An Unhealthy AmericaMilken Institut
- Page 18 and 19:
An Unhealthy AmericaMilken Institut
- Page 20:
An Unhealthy AmericaMilken Institut
- Page 23 and 24:
An Unhealthy AmericaMilken Institut
- Page 25 and 26:
An Unhealthy AmericaMilken Institut
- Page 28 and 29:
An Unhealthy AmericaMilken Institut
- Page 30 and 31:
An Unhealthy AmericaMilken Institut
- Page 32 and 33:
An Unhealthy AmericaMilken Institut
- Page 34 and 35:
An Unhealthy AmericaMilken Institut
- Page 36:
An Unhealthy AmericaMilken Institut
- Page 39 and 40:
An Unhealthy AmericaMilken Institut
- Page 42 and 43:
An Unhealthy AmericaMilken Institut
- Page 44:
An Unhealthy AmericaMilken Institut
- Page 48 and 49:
An Unhealthy AmericaMilken Institut
- Page 50 and 51:
An Unhealthy AmericaMilken Institut
- Page 52 and 53:
An Unhealthy AmericaMilken Institut
- Page 54 and 55:
An Unhealthy AmericaMilken Institut
- Page 56 and 57:
An Unhealthy AmericaMilken Institut
- Page 58 and 59:
An Unhealthy AmericaMilken Institut
- Page 60 and 61:
An Unhealthy AmericaMilken Institut
- Page 62 and 63:
An Unhealthy AmericaMilken Institut
- Page 64 and 65:
An Unhealthy AmericaMilken Institut
- Page 66 and 67:
An Unhealthy AmericaMilken Institut
- Page 68 and 69:
An Unhealthy AmericaMilken Institut
- Page 70 and 71:
An Unhealthy AmericaMilken Institut
- Page 72 and 73:
An Unhealthy AmericaMilken Institut
- Page 74 and 75:
An Unhealthy AmericaMilken Institut
- Page 76 and 77:
An Unhealthy AmericaMilken Institut
- Page 78 and 79:
An Unhealthy AmericaMilken Institut
- Page 80:
An Unhealthy AmericaMilken Institut
- Page 83 and 84:
An Unhealthy AmericaMilken Institut
- Page 85 and 86:
An Unhealthy AmericaMilken Institut
- Page 87 and 88:
An Unhealthy AmericaMilken Institut
- Page 89 and 90:
An Unhealthy AmericaMilken Institut
- Page 91 and 92:
An Unhealthy AmericaMilken Institut
- Page 93 and 94:
An Unhealthy AmericaMilken Institut
- Page 95 and 96:
An Unhealthy AmericaMilken Institut
- Page 98 and 99:
An Unhealthy AmericaMilken Institut
- Page 100 and 101:
An Unhealthy AmericaMilken Institut
- Page 102 and 103:
An Unhealthy AmericaMilken Institut
- Page 104 and 105:
An Unhealthy AmericaMilken Institut
- Page 106 and 107:
An Unhealthy AmericaMilken Institut
- Page 108 and 109:
An Unhealthy AmericaMilken Institut
- Page 110 and 111:
An Unhealthy AmericaMilken Institut
- Page 112 and 113:
An Unhealthy AmericaMilken Institut
- Page 114 and 115:
An Unhealthy AmericaMilken Institut
- Page 116 and 117:
An Unhealthy AmericaMilken Institut
- Page 118 and 119:
An Unhealthy AmericaMilken Institut
- Page 120 and 121:
An Unhealthy AmericaMilken Institut
- Page 122 and 123:
An Unhealthy AmericaMilken Institut
- Page 124 and 125:
An Unhealthy AmericaMilken Institut
- Page 126 and 127:
An Unhealthy AmericaMilken Institut
- Page 128 and 129:
An Unhealthy AmericaMilken Institut
- Page 130 and 131:
An Unhealthy AmericaMilken Institut
- Page 132 and 133:
An Unhealthy AmericaMilken Institut
- Page 134 and 135:
An Unhealthy AmericaMilken Institut
- Page 136 and 137:
An Unhealthy AmericaMilken Institut
- Page 138 and 139:
An Unhealthy AmericaMilken Institut
- Page 140 and 141:
An Unhealthy AmericaMilken Institut
- Page 142 and 143:
An Unhealthy AmericaMilken Institut
- Page 144 and 145:
An Unhealthy AmericaMilken Institut
- Page 146 and 147:
An Unhealthy AmericaMilken Institut
- Page 148 and 149:
An Unhealthy AmericaMilken Institut
- Page 150 and 151:
An Unhealthy AmericaMilken Institut
- Page 152 and 153:
An Unhealthy AmericaMilken Institut
- Page 154 and 155:
An Unhealthy AmericaMilken Institut
- Page 156 and 157:
An Unhealthy AmericaMilken Institut
- Page 160 and 161:
An Unhealthy AmericaMilken Institut
- Page 162:
An Unhealthy AmericaMilken Institut
- Page 165 and 166:
An Unhealthy AmericaMilken Institut
- Page 167 and 168:
An Unhealthy AmericaMilken Institut
- Page 169 and 170:
An Unhealthy AmericaMilken Institut
- Page 171 and 172:
An Unhealthy AmericaMilken Institut
- Page 173 and 174:
An Unhealthy AmericaMilken Institut
- Page 175 and 176:
An Unhealthy AmericaMilken Institut
- Page 177 and 178:
An Unhealthy AmericaMilken Institut
- Page 180 and 181:
An Unhealthy AmericaMilken Institut
- Page 182 and 183:
An Unhealthy AmericaMilken Institut
- Page 184 and 185:
An Unhealthy AmericaMilken Institut
- Page 186 and 187: An Unhealthy AmericaMilken Institut
- Page 188 and 189: An Unhealthy AmericaMilken Institut
- Page 190 and 191: An Unhealthy AmericaMilken Institut
- Page 192 and 193: An Unhealthy AmericaMilken Institut
- Page 194 and 195: An Unhealthy AmericaMilken Institut
- Page 196 and 197: An Unhealthy AmericaMilken Institut
- Page 198 and 199: An Unhealthy AmericaMilken Institut
- Page 200 and 201: An Unhealthy AmericaMilken Institut
- Page 202 and 203: An Unhealthy AmericaMilken Institut
- Page 204 and 205: An Unhealthy AmericaMilken Institut
- Page 206 and 207: An Unhealthy AmericaMilken Institut
- Page 208 and 209: An Unhealthy AmericaMilken Institut
- Page 210 and 211: An Unhealthy AmericaMilken Institut
- Page 212 and 213: An Unhealthy AmericaMilken Institut
- Page 214 and 215: An Unhealthy AmericaMilken Institut
- Page 216 and 217: An Unhealthy AmericaMilken Institut
- Page 218 and 219: An Unhealthy AmericaMilken Institut
- Page 220 and 221: An Unhealthy AmericaMilken Institut
- Page 222 and 223: An Unhealthy AmericaMilken Institut
- Page 224 and 225: An Unhealthy AmericaMilken Institut
- Page 226 and 227: An Unhealthy AmericaMilken Institut
- Page 228 and 229: An Unhealthy AmericaMilken Institut
- Page 230 and 231: An Unhealthy AmericaMilken Institut
- Page 232 and 233: An Unhealthy AmericaMilken Institut
- Page 234 and 235: An Unhealthy AmericaMilken Institut
- Page 238 and 239: An Unhealthy AmericaMilken Institut
- Page 240 and 241: An Unhealthy AmericaMilken Institut
- Page 242 and 243: An Unhealthy AmericaMilken Institut
- Page 244 and 245: An Unhealthy AmericaMilken Institut
- Page 246 and 247: An Unhealthy AmericaMilken Institut
- Page 248 and 249: An Unhealthy AmericaMilken Institut
- Page 250 and 251: An Unhealthy AmericaMilken Institut
- Page 252: 1250 Fourth Street • Santa Monica