

An Unhealthy America: The Economic Burden of ... - Milken Institute
An Unhealthy America: The Economic Burden of ... - Milken Institute
An Unhealthy America: The Economic Burden of ... - Milken Institute

Create successful ePaper yourself
Turn your PDF publications into a flip-book with our unique Google optimized e-Paper software.
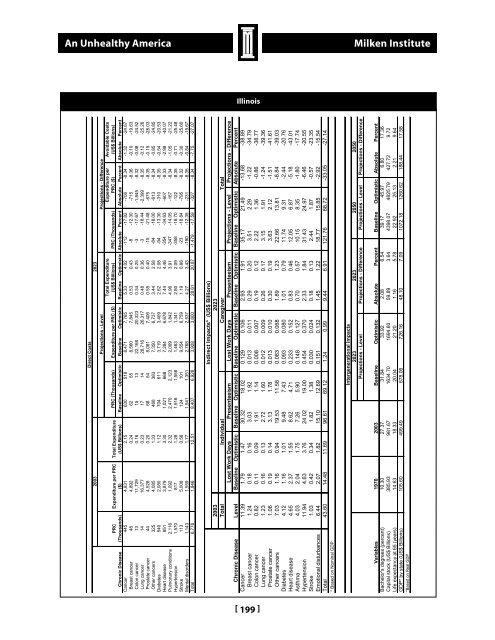
<strong>An</strong> <strong>Unhealthy</strong> <strong>America</strong><strong>Milken</strong> <strong>Institute</strong>IllinoisIllinoisDirect Costs2003 2023Projections - Level Projections - DifferenceAvoidable Costs(US$ Billions)Expenditure perPRC ($)Total Expenditure(US$ Billions) PRC (Thousands)PRC (Thousands) Expenditure per PRC ($)Baseline Optimistic Baseline Optimistic Baseline Optimistic Absolute Percent Absolute Percent Absolute PercentTotal Expenditure(US$ Billions)Expenditure per PRC($)PRC(Thousands)Chronic DiseaseDiseaseExpenditures(Billions)PRC*(Millions)Cancer 48.1 10.6 4.5Breast Cancer 5.5 1.1 4.8Colon Cancer 3.9 0.3 11.5Lung Cancer 6.3 0.4 17.1Prostate Cancer 4.3 1.0 4.1Other Cancers 28.0 7.7 3.6Pulmonary Conditions 45.2 49.2 0.9Diabetes 27.1 13.7 2.0Hypertension 32.5 36.8 0.9Heart Disease 64.7 19.2 3.4Cancer 445 4,831 2.15 630 518 8,471 7,765 5.33 4.02 -112 -17.82 -706 -8.34 -1.32 -24.67Breast cancer 48 4,892 0.24 62 55 8,560 7,845 0.53 0.43 -8 -12.30 -715 -8.36 -0.10 -19.63Colon cancer 13 11,729 0.16 15 13 22,168 20,323 0.34 0.25 -3 -17.67 -1,845 -8.32 -0.08 -24.52Lung cancer 14 16,377 0.23 17 14 28,716 26,317 0.48 0.36 -3 -18.44 -2,399 -8.35 -0.12 -25.26Prostate cancer 44 4,528 0.20 68 54 8,081 7,406 0.55 0.40 -15 -21.48 -675 -8.35 -0.15 -28.03Other cancers 325 4,085 1.33 468 383 7,350 6,737 3.44 2.58 -84 -18.00 -613 -8.34 -0.85 -24.85Diabetes 540 2,080 1.12 704 611 3,719 3,409 2.62 2.08 -94 -13.30 -310 -8.35 -0.54 -20.53Heart disease 851 3,879 3.30 1,021 668 7,284 6,678 7.44 4.46 -354 -34.63 -607 -8.33 -2.98 -40.07Pulmonary conditions 2,116 1,092 2.32 2,470 2,123 2,009 1,842 4.96 3.91 -347 -14.05 -167 -8.34 -1.05 -21.22Hypertension 1,570 817 1.28 1,916 1,558 1,463 1,341 2.80 2.09 -358 -18.70 -122 -8.35 -0.71 -25.48Stroke 113 5,008 0.56 124 101 9,554 8,759 1.19 0.88 -23 -18.84 -795 -8.32 -0.30 -25.60Mental disorders 1,143 1,559 1.77 1,541 1,351 2,768 2,537 4.27 3.43 -190 -12.35 -231 -8.35 -0.84 -19.67Total 6,778 1,846 12.51 8,407 6,928 3,928 3,600 28.61 20.87 -1,479 -17.59 -327 -8.34 -7.75 -27.07Indirect Impacts* (US$ Billions)2023Individual Caregiver TotalLost Work Days Presenteeism Lost Work Days Presenteeism Projections - Level Projections - DifferenceBaseline Optimistic Baseline Optimistic Baseline Optimistic Baseline Optimistic Baseline Optimistic Absolute Percent2003TotalLevelChronic DiseaseCancer 11.39 1.79 1.47 30.32 18.02 0.129 0.106 2.93 1.91 35.17 21.49 -13.68 -38.89Breast cancer 1.24 0.18 0.16 3.03 1.92 0.013 0.011 0.29 0.20 3.51 2.29 -1.22 -34.79Colon cancer 0.82 0.11 0.09 1.91 1.14 0.008 0.007 0.19 0.12 2.22 1.36 -0.86 -38.77Lung cancer 1.23 0.16 0.13 2.72 1.60 0.012 0.009 0.26 0.17 3.15 1.91 -1.24 -39.36Prostate cancer 1.06 0.19 0.14 3.13 1.78 0.013 0.010 0.30 0.19 3.63 2.12 -1.51 -41.61Other cancers 7.03 1.16 0.94 19.53 11.58 0.083 0.068 1.89 1.23 22.66 13.81 -8.84 -39.03Diabetes 4.12 1.16 1.01 9.48 7.43 0.093 0.080 1.01 0.79 11.74 9.31 -2.44 -20.76Heart disease 4.65 2.37 1.55 8.62 4.71 0.233 0.152 0.83 0.46 12.05 6.87 -5.18 -43.01Asthma 4.03 2.04 1.75 7.26 5.90 0.148 0.127 0.70 0.57 10.15 8.35 -1.80 -17.74Hypertension 11.94 4.63 3.76 24.02 19.00 0.454 0.370 2.33 1.84 31.43 24.97 -6.46 -20.55Stroke 1.03 0.42 0.34 1.82 1.38 0.030 0.024 0.18 0.13 2.44 1.87 -0.57 -23.35Emotional disturbances 6.44 2.07 1.82 15.10 12.69 0.151 0.132 1.45 1.22 18.77 15.85 -2.92 -15.54Total 43.60 14.48 11.69 96.61 69.12 1.24 0.99 9.44 6.91 121.76 88.72 -33.05 -27.14* Based on Nominal GDPExpenditures/PRC(Thousands)Intergenerational Impacts2023 2023 2050 2050Projections - LevelProjections - Difference Projections - Level Projections - DifferenceStroke 13.6 2.4 5.6Mental Disorders 45.8 30.3 1.5Total 277.0 162.2 1.7PRC: Population Reporting ConditionPercentBaseline Optimistic Absolute Percent Baseline Optimistic Absolute1970 2003VariablesBachelor's degrees (percent) 10.30 27.37 31.84 33.92 2.08 6.54 39.17 45.97 6.80 17.36Capital stock (US$ Billions) 385.93 981.67 1634.70 1694.60 59.89 3.64 4398.07 4825.79 427.72 9.72Life expectancy at 65 (years) 14.63 18.33 20.04 21.20 1.16 5.78 22.92 25.13 2.21 9.64GDP* by state (US$ Billions) 105.60 499.49 678.06 726.16 48.10 7.09 1072.18 1260.62 188.44 17.58*Based on Real GDP[ 199 ]


