

An Unhealthy America: The Economic Burden of ... - Milken Institute
An Unhealthy America: The Economic Burden of ... - Milken Institute
An Unhealthy America: The Economic Burden of ... - Milken Institute

Create successful ePaper yourself
Turn your PDF publications into a flip-book with our unique Google optimized e-Paper software.
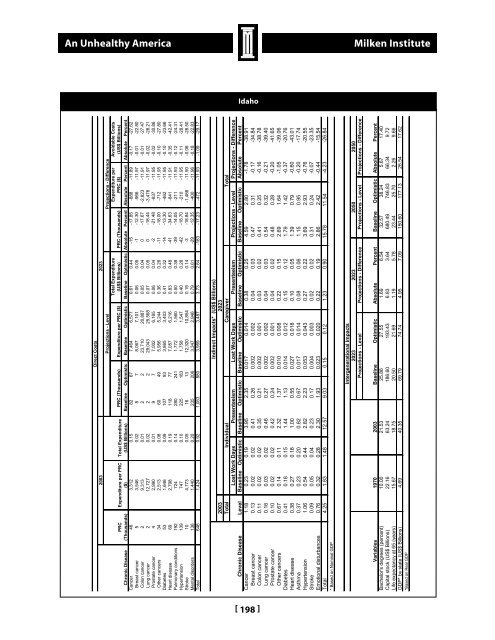
<strong>An</strong> <strong>Unhealthy</strong> <strong>America</strong><strong>Milken</strong> <strong>Institute</strong>IdahoIdahoDirect Costs2003 2023Avoidable Costs(US$ Billions)Projections - Level Projections - DifferencePRC (Thousands) Expenditure per PRC ($) Total Expenditure(US$ Billions) PRC (Thousands) Expenditure perPRC ($)Baseline Optimistic Baseline Optimistic Baseline Optimistic Absolute Percent Absolute Percent Absolute PercentTotal Expenditure(US$ Billions)Expenditure per PRC($)PRC(Thousands)Chronic DiseaseDiseaseExpenditures(Billions)PRC*(Millions)Cancer 48.1 10.6 4.5Breast Cancer 5.5 1.1 4.8Colon Cancer 3.9 0.3 11.5Lung Cancer 6.3 0.4 17.1Prostate Cancer 4.3 1.0 4.1Cancer 46 3,312 0.15 82 67 7,464 6,577 0.61 0.44 -15 -17.85 -888 -11.89 -0.17 -27.62Breast cancer 5 3,546 0.02 8 7 8,067 7,101 0.06 0.05 -1 -12.30 -966 -11.97 -0.01 -22.80Colon cancer 2 9,313 0.01 2 2 23,710 20,887 0.05 0.04 0 -17.67 -2,823 -11.91 -0.01 -27.47Lung cancer 2 12,727 0.02 2 2 29,043 25,568 0.07 0.05 0 -18.44 -3,476 -11.97 -0.02 -28.21Prostate cancer 4 2,990 0.01 9 7 7,002 6,165 0.06 0.04 -2 -21.48 -837 -11.95 -0.02 -30.86Other cancers 34 2,513 0.08 60 49 5,956 5,244 0.36 0.26 -11 -18.00 -712 -11.95 -0.10 -27.80Diabetes 53 1,646 0.09 107 93 3,865 3,403 0.41 0.32 -14 -13.30 -462 -11.95 -0.10 -23.66Heart disease 69 2,798 0.19 118 77 7,057 6,216 0.83 0.48 -41 -34.63 -841 -11.91 -0.35 -42.41Pulmonary conditions 192 724 0.14 280 241 1,772 1,560 0.50 0.38 -39 -14.05 -211 -11.93 -0.12 -24.31Hypertension 139 747 0.10 225 183 1,758 1,547 0.40 0.28 -42 -18.70 -210 -11.95 -0.11 -28.41Stroke 10 4,773 0.05 16 13 12,320 10,854 0.19 0.14 -3 -18.84 -1,466 -11.90 -0.06 -28.50Mental disorders 136 1,440 0.20 235 206 3,347 2,946 0.79 0.61 -29 -12.35 -400 -11.96 -0.18 -22.83Total 646 1,424 0.92 1,063 880 3,959 3,487 3.73 2.64 -183 -17.23 -472 -11.93 -1.09 -29.17Indirect Impacts* (US$ Billions)TotalLost Work Days Presenteeism Lost Work Days Presenteeism Projections - Level Projections - DifferenceBaseline Optimistic Baseline Optimistic Baseline Optimistic Baseline Optimistic Baseline Optimistic Absolute Percent2023Individual Caregiver2003TotalLevelChronic DiseaseCancer 1.18 0.23 0.19 3.95 2.35 0.017 0.014 0.38 0.25 4.59 2.80 -1.78 -38.91Breast cancer 0.13 0.02 0.02 0.41 0.26 0.002 0.002 0.04 0.03 0.47 0.31 -0.17 -34.84Colon cancer 0.11 0.02 0.02 0.35 0.21 0.002 0.001 0.03 0.02 0.41 0.25 -0.16 -38.78Lung cancer 0.16 0.03 0.02 0.46 0.27 0.002 0.002 0.04 0.03 0.54 0.32 -0.21 -39.40Prostate cancer 0.10 0.02 0.02 0.42 0.24 0.002 0.001 0.04 0.02 0.48 0.28 -0.20 -41.65Other cancers 0.67 0.14 0.11 2.32 1.37 0.010 0.008 0.22 0.15 2.69 1.64 -1.05 -39.06Diabetes 0.41 0.18 0.15 1.44 1.13 0.014 0.012 0.15 0.12 1.79 1.42 -0.37 -20.76Heart disease 0.38 0.27 0.18 1.00 0.55 0.027 0.018 0.10 0.05 1.39 0.79 -0.60 -43.01Asthma 0.37 0.23 0.20 0.82 0.67 0.017 0.014 0.08 0.06 1.15 0.95 -0.20 -17.74Hypertension 1.06 0.54 0.44 2.82 2.23 0.053 0.043 0.27 0.22 3.69 2.93 -0.76 -20.55Stroke 0.09 0.05 0.04 0.23 0.17 0.004 0.003 0.02 0.02 0.31 0.24 -0.07 -23.35Emotional disturbances 0.76 0.32 0.28 2.30 1.93 0.023 0.020 0.22 0.19 2.86 2.42 -0.44 -15.54Total 4.25 1.83 1.48 12.57 9.03 0.15 0.12 1.23 0.90 15.78 11.54 -4.23 -26.84* Based on Nominal GDPExpenditures/PRC(Thousands)Intergenerational Impacts2023 2023 2050 2050Projections - Level Projections - Difference Projections - Level Projections - DifferenceOther Cancers 28.0 7.7 3.6Pulmonary Conditions 45.2 49.2 0.9Diabetes 27.1 13.7 2.0Hypertension 32.5 36.8 0.9Heart Disease 64.7 19.2 3.4Stroke 13.6 2.4 5.6Mental Disorders 45.8 30.3 1.5Total 277.0 162.2 1.7PRC: Population Reporting ConditionBaseline Optimistic Absolute PercentBaseline Optimistic Absolute Percent1970 2003VariablesBachelor's degrees (percent) 10.00 21.53 25.86 27.55 1.69 6.54 32.57 38.24 5.67 17.40Capital stock (US$ Billions) 22.16 63.24 186.60 193.43 6.83 3.64 680.49 746.83 66.34 9.72Life expectancy at 65 (years) 15.67 18.75 20.50 21.69 1.19 5.78 23.44 25.70 2.26 9.66GDP* by state (US$ Billions) 4.69 40.35 69.79 74.74 4.95 7.09 150.60 177.13 26.54 17.62*Based on Real GDP[ 198 ]


